
A simple, beautiful UI to monitor ClickHouse
chmonitor turns your cluster's system tables into a fast, readable dashboard — queries, merges, parts, replication and health, plus an AI agent that answers questions about your data. Self-host it, or use the hosted cloud.
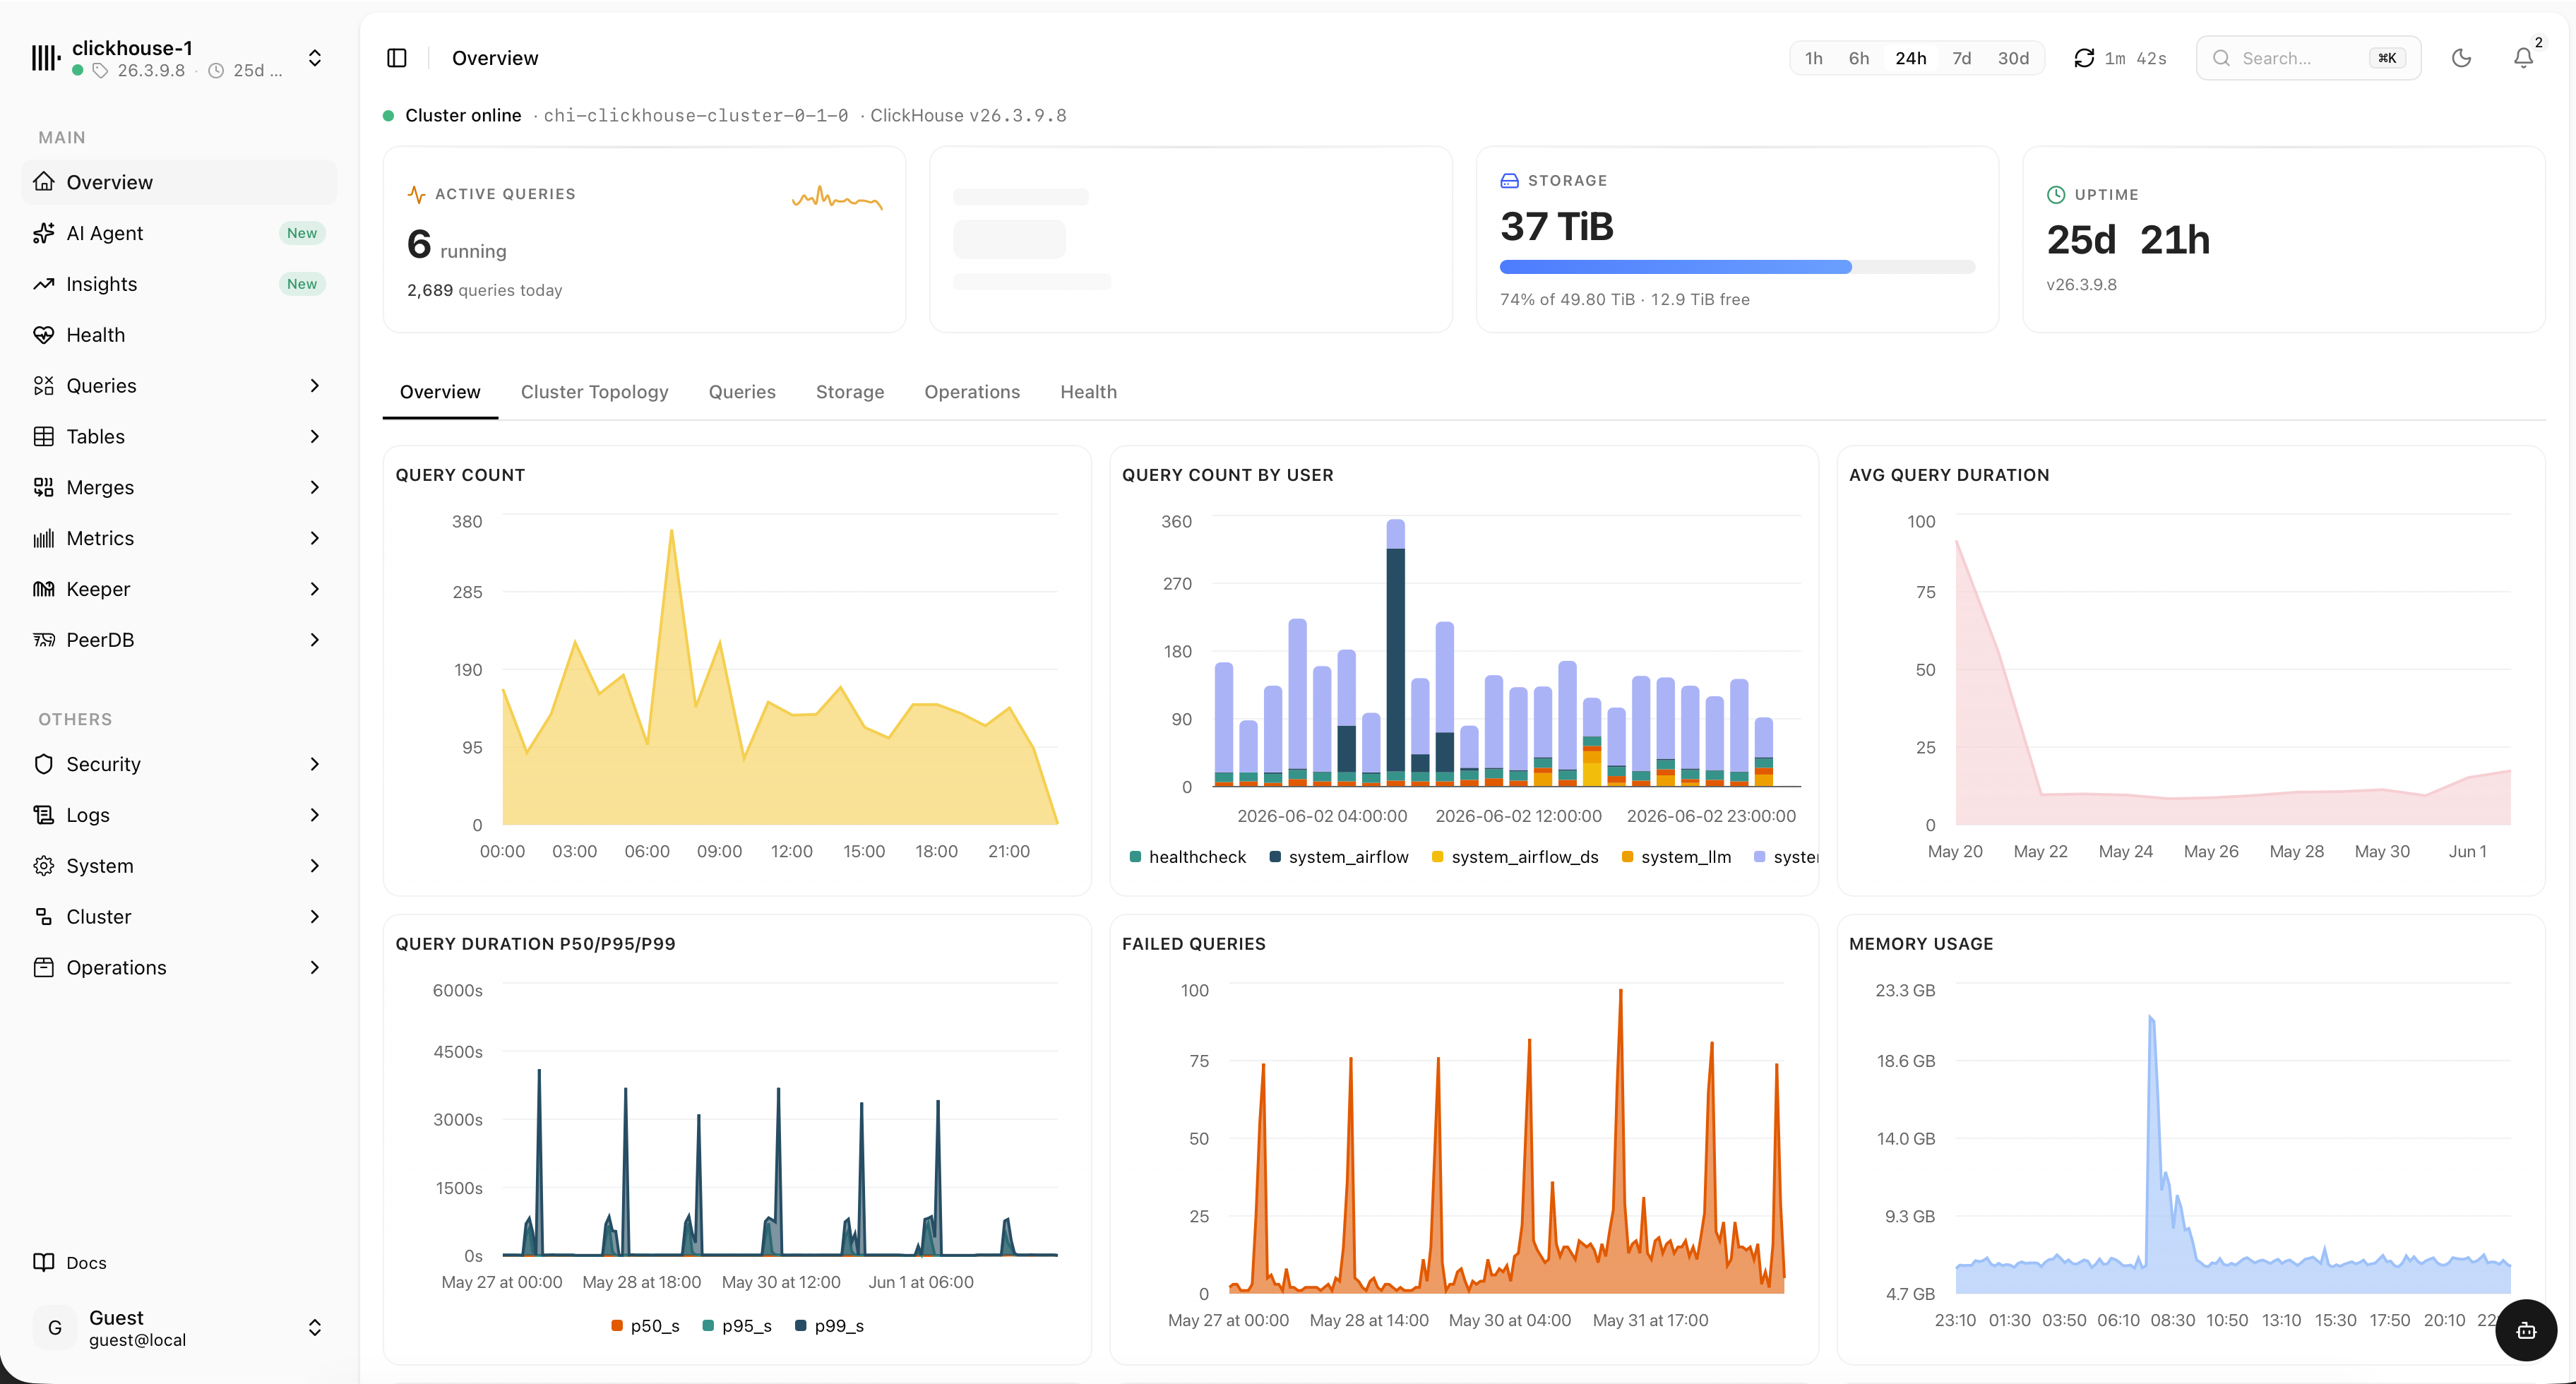
Everything about your cluster, in one place
chmonitor reads ClickHouse system tables directly — no exporters, no extra storage. Each view is purpose-built so you can spot the problem and move on.
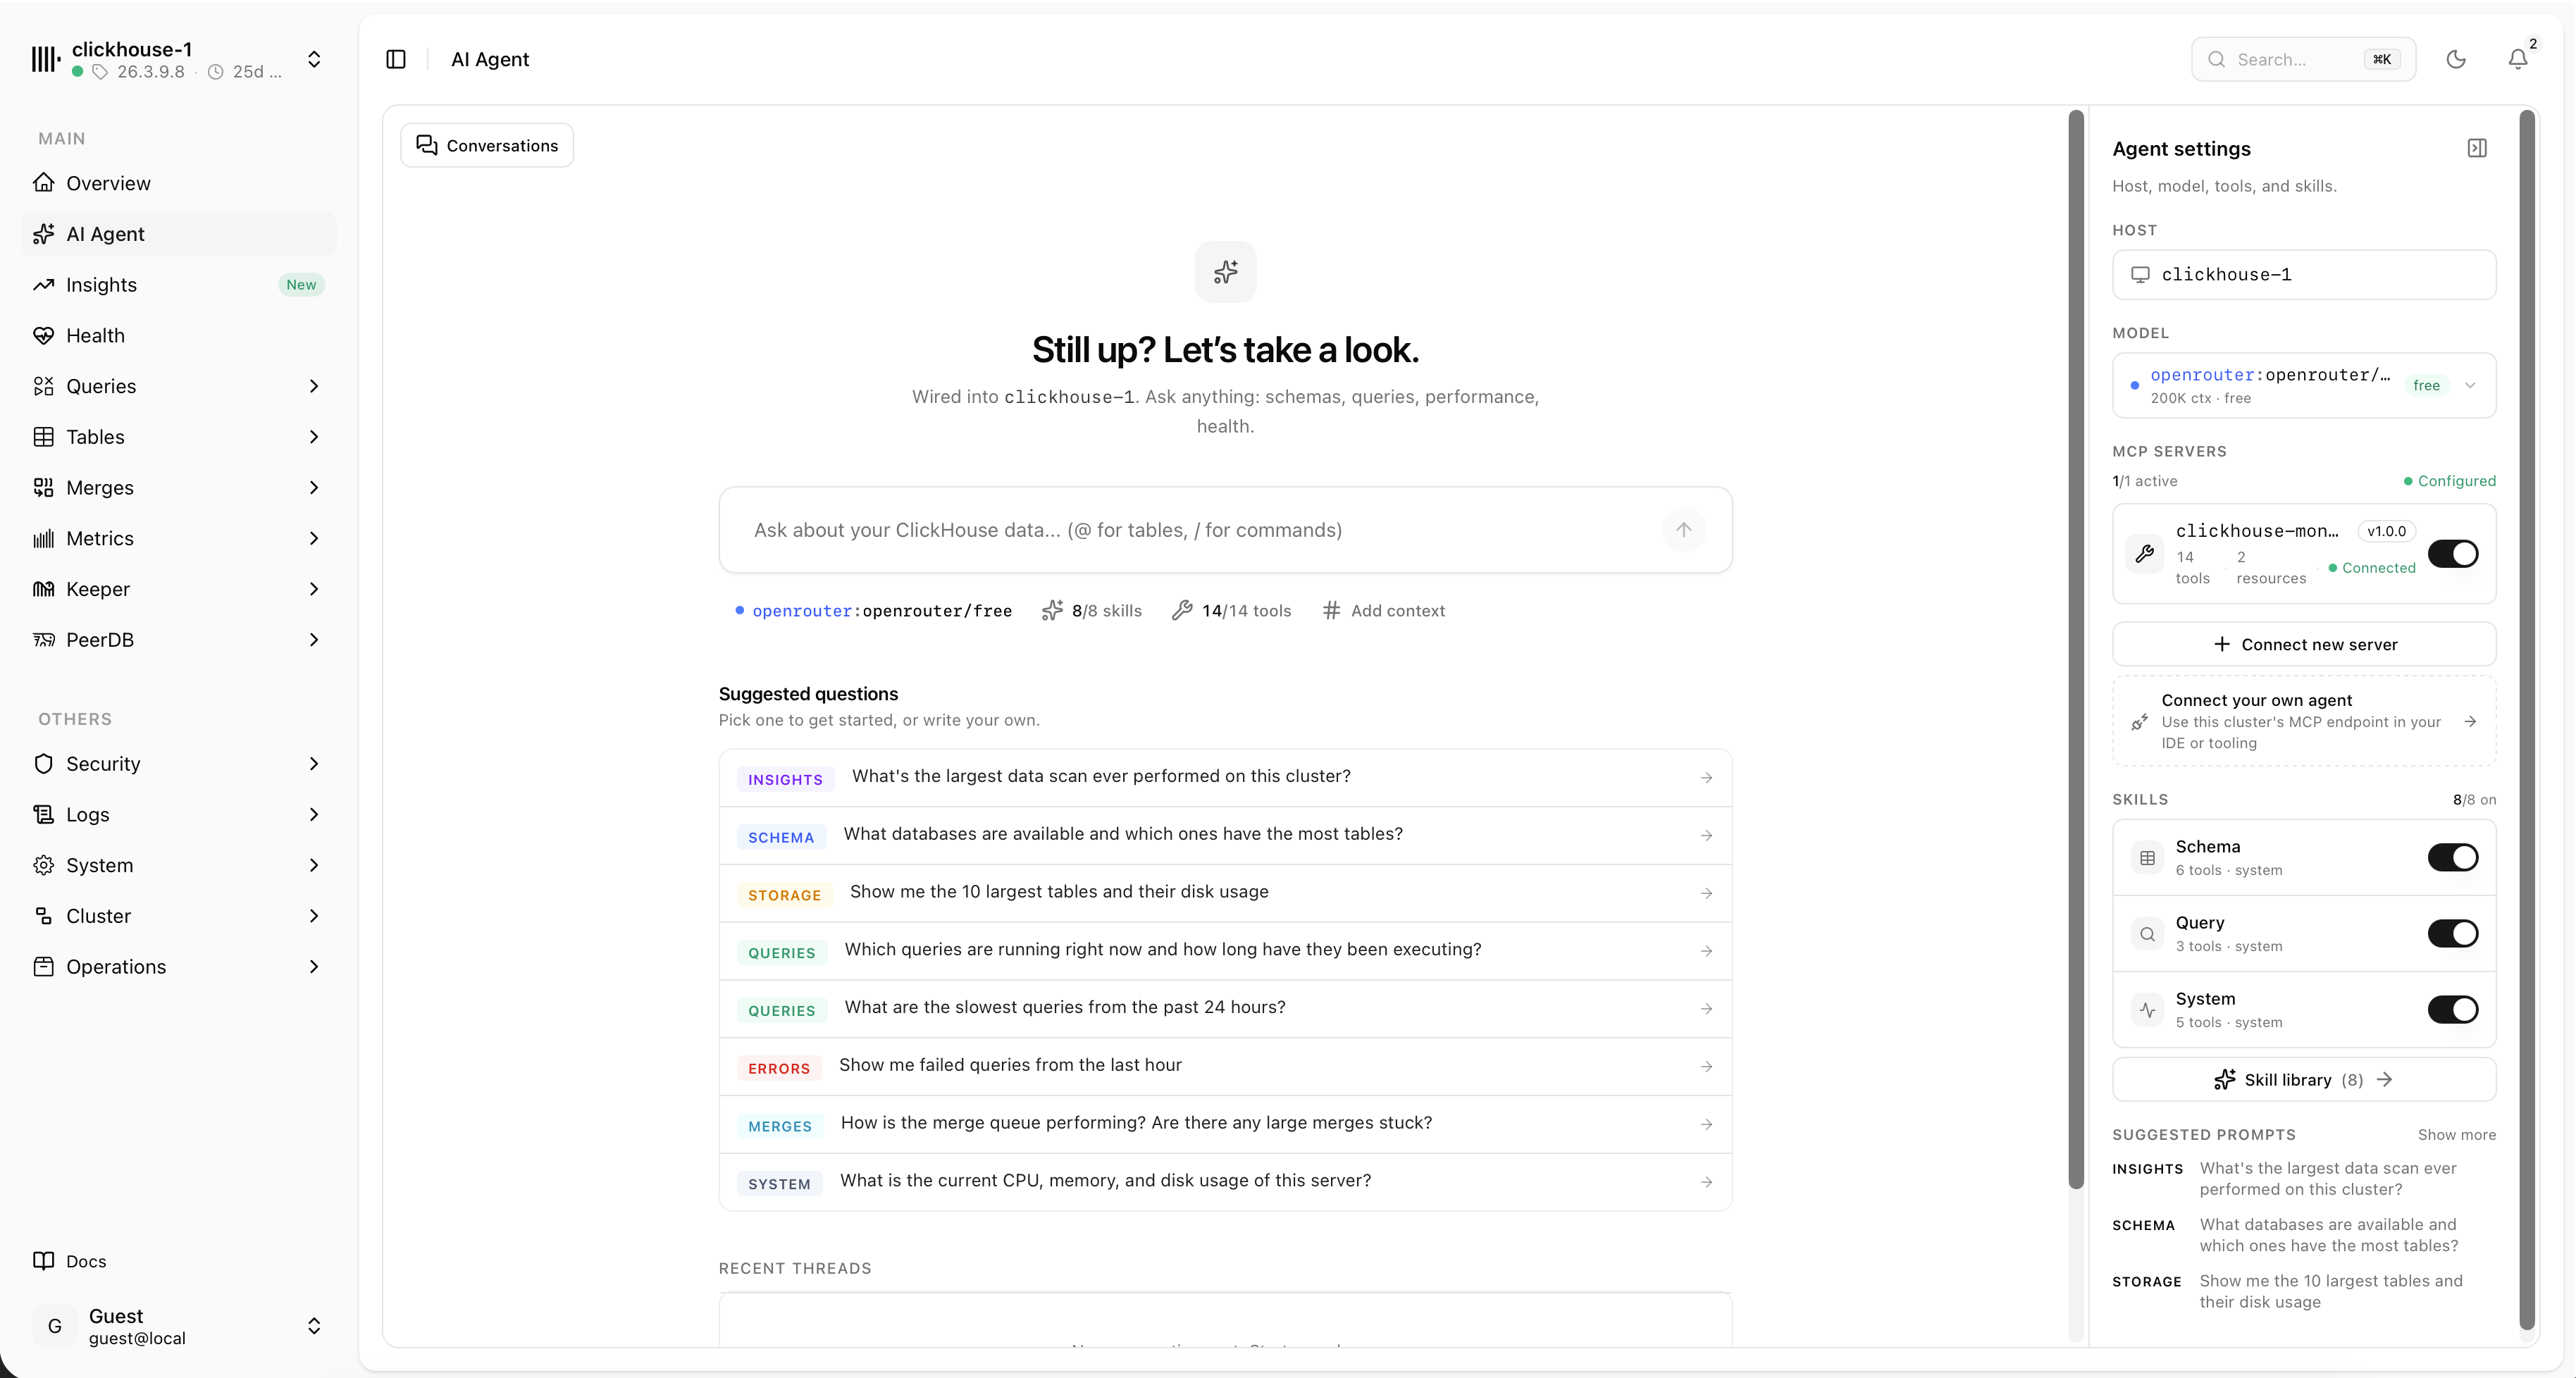
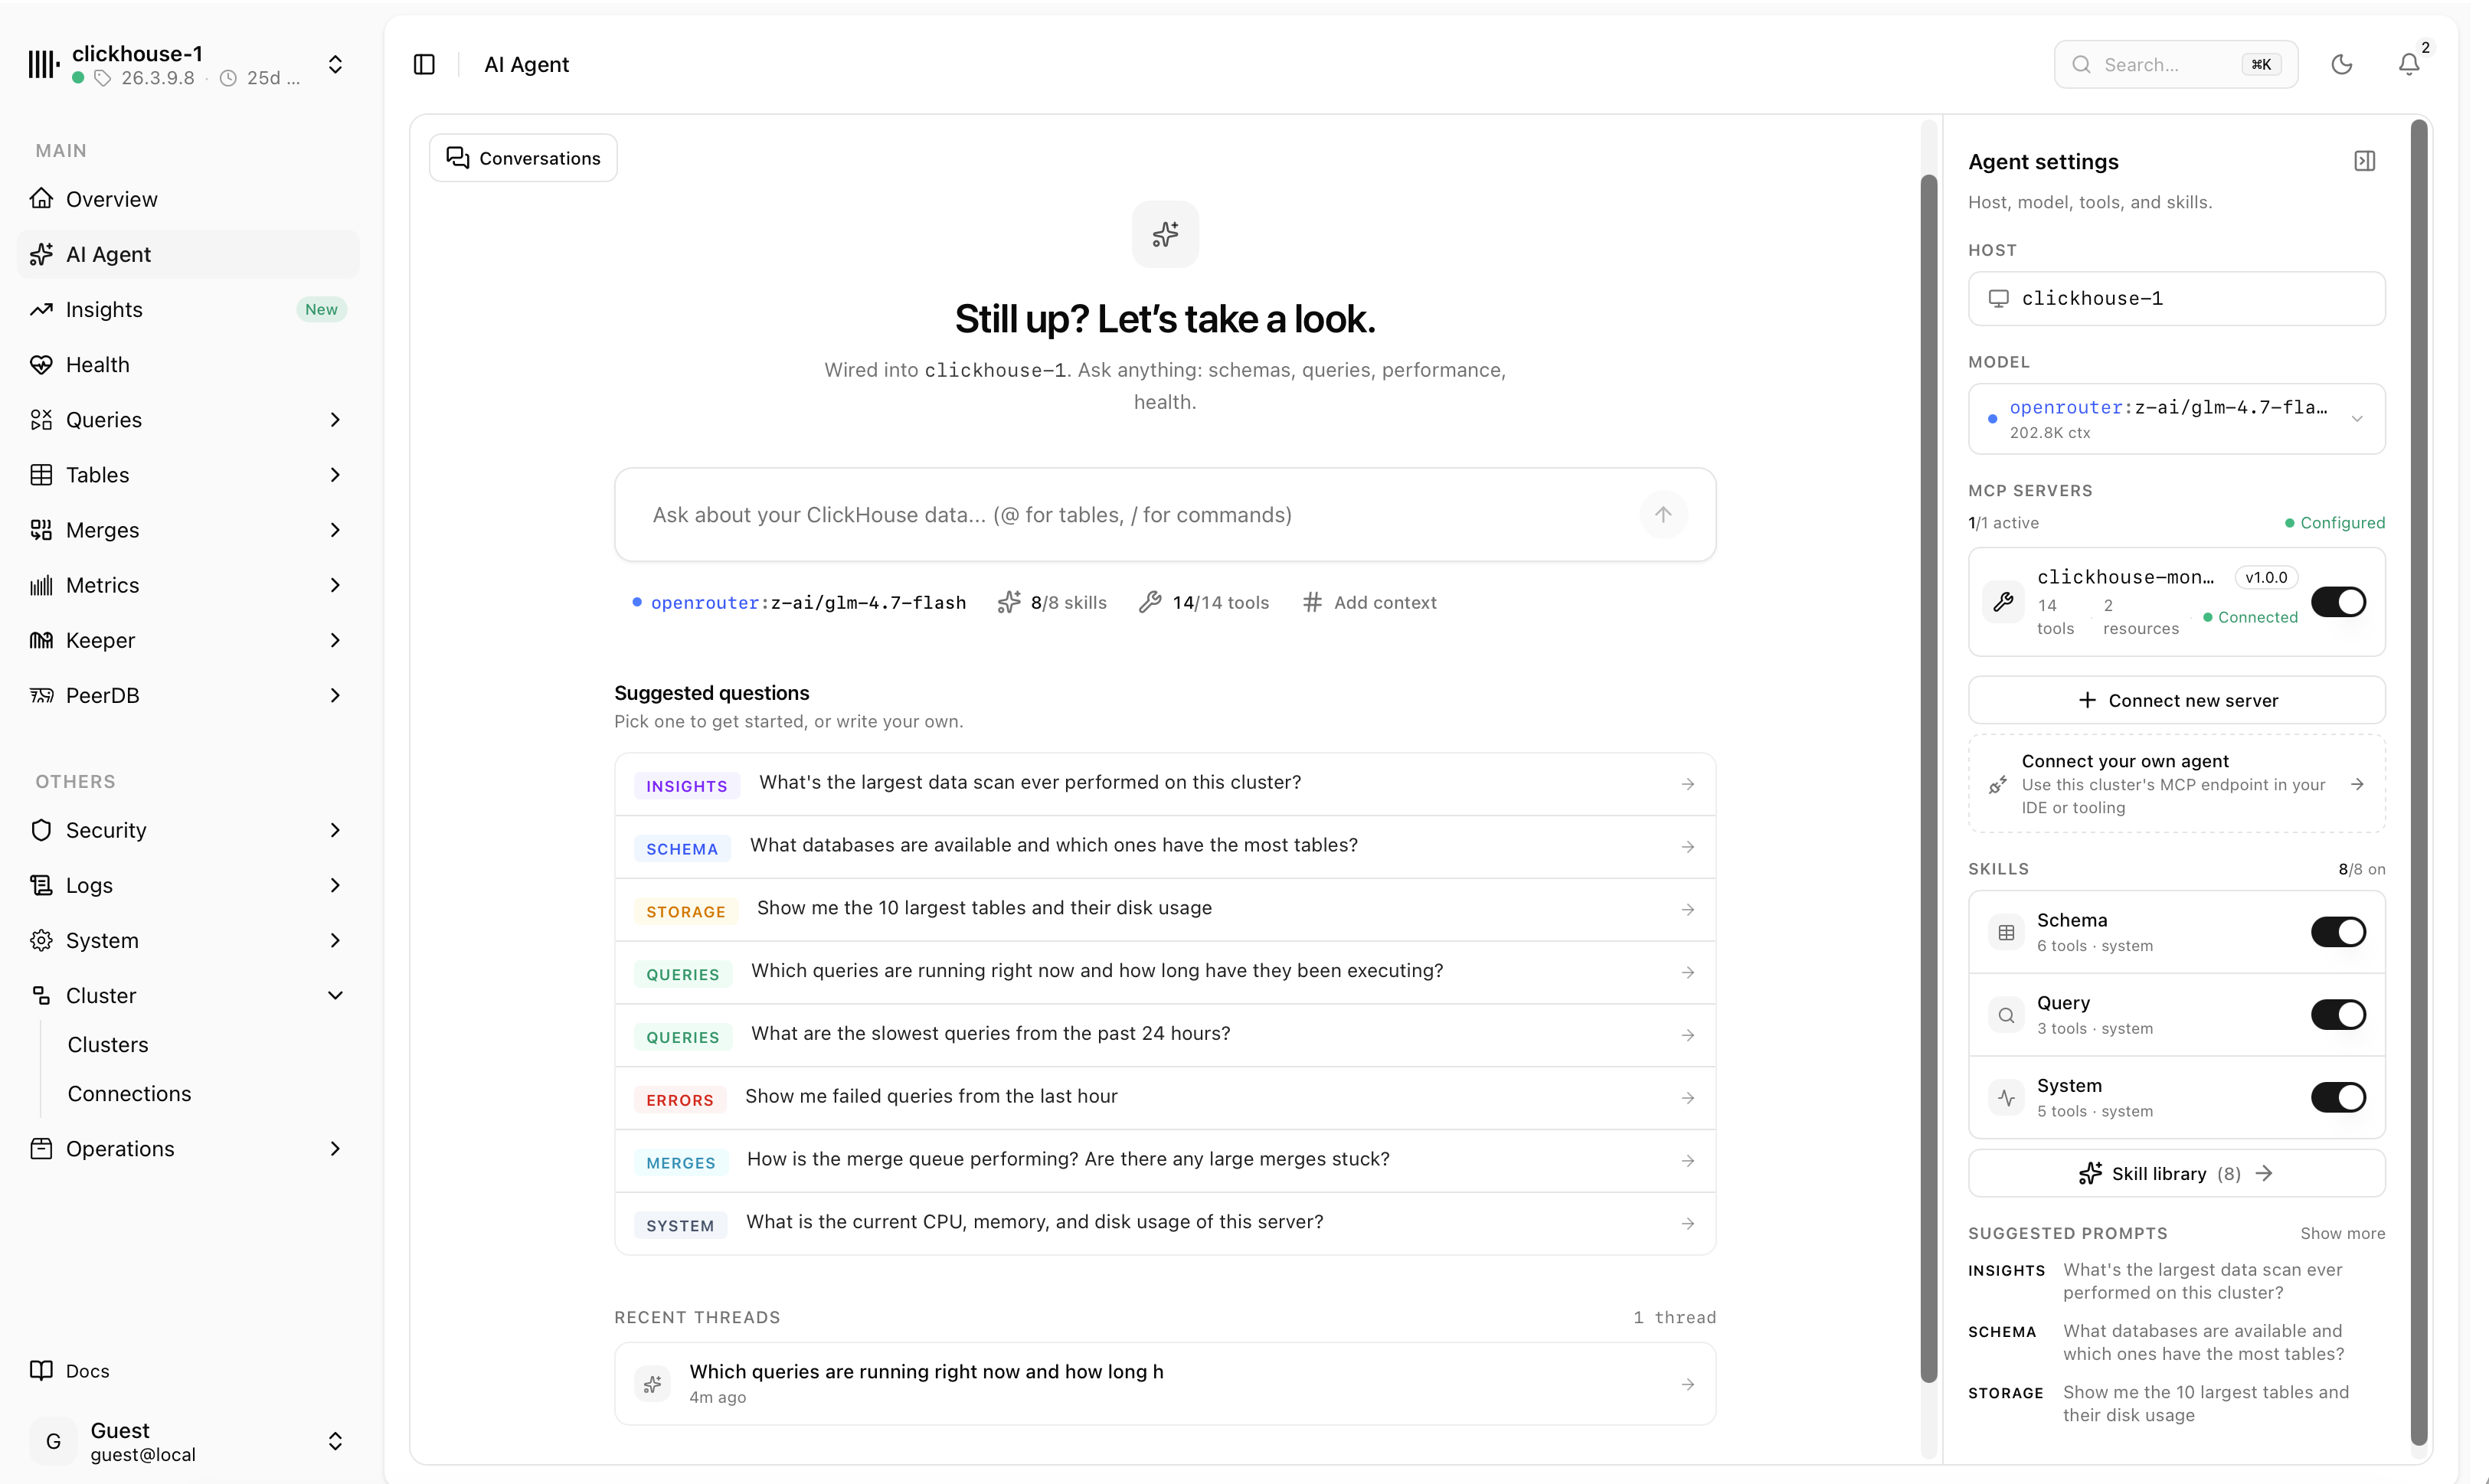
Ask your cluster anything
The built-in AI agent connects over MCP and answers questions about schemas, storage, query performance and health — then links you straight to the matching view.
- Chat about schema, storage, slow queries and system health
- Bring your own model, skills and MCP tools
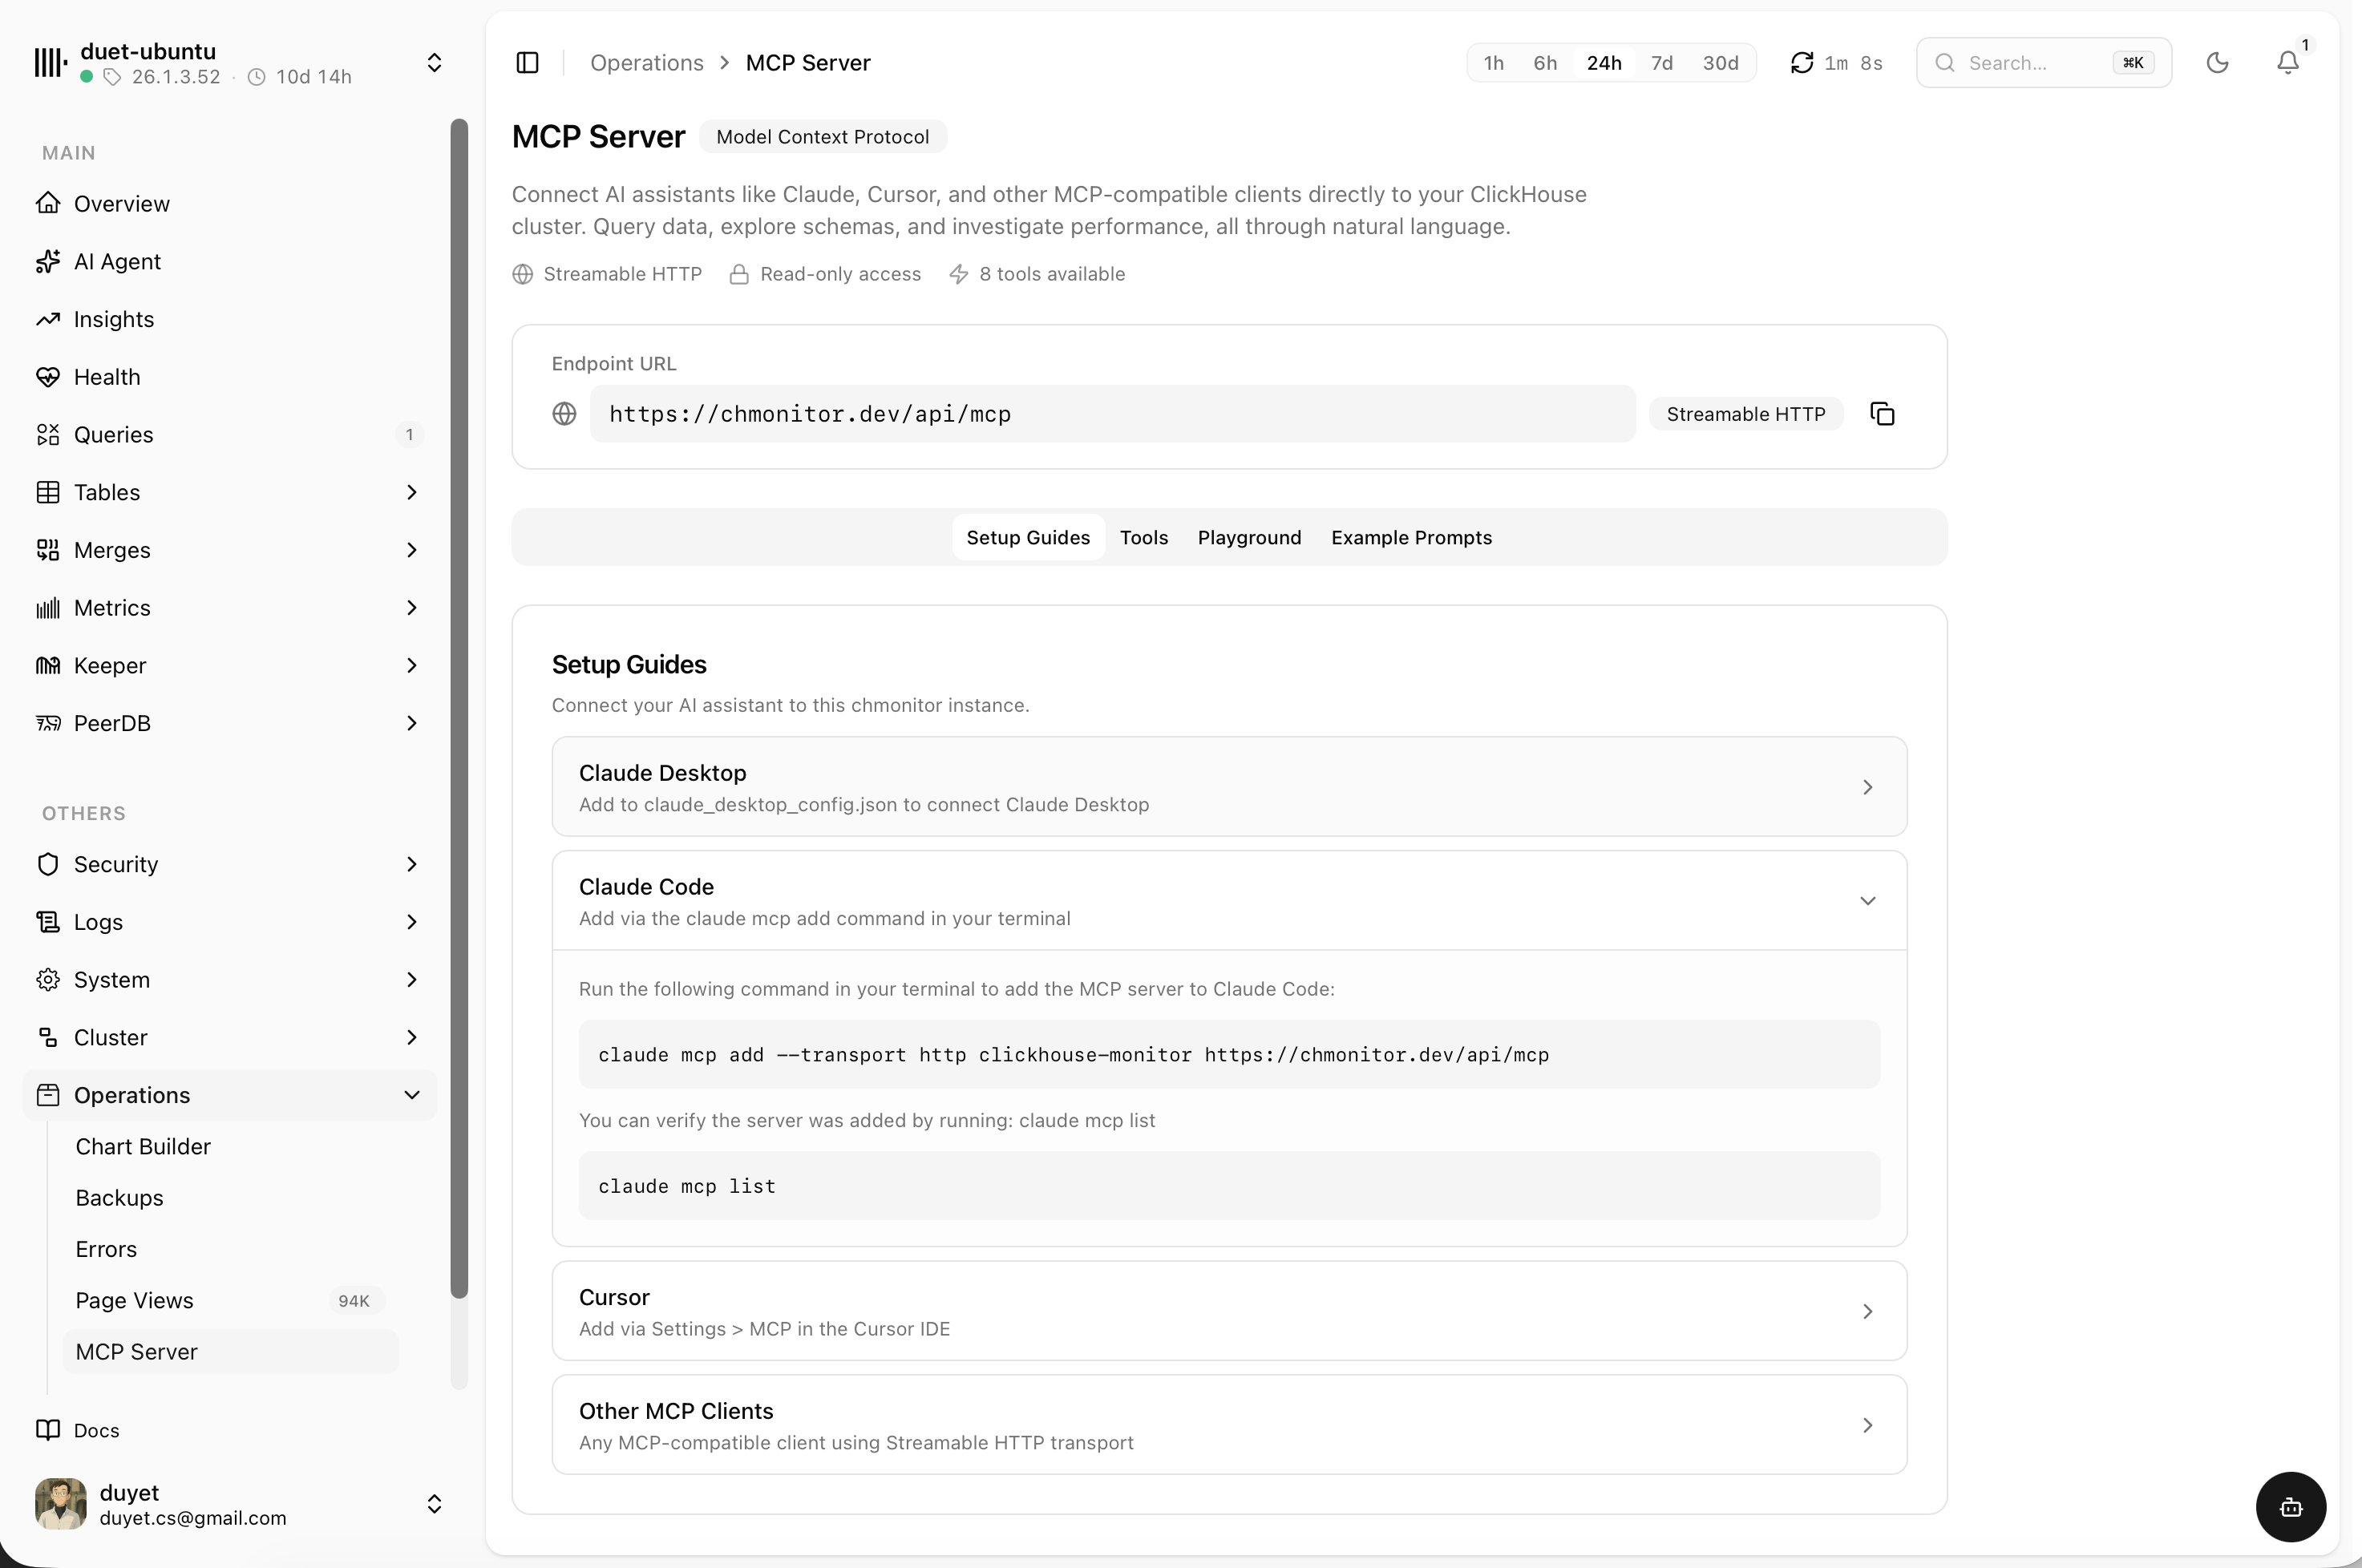
- Read-only MCP endpoint for Claude, Cursor or any client
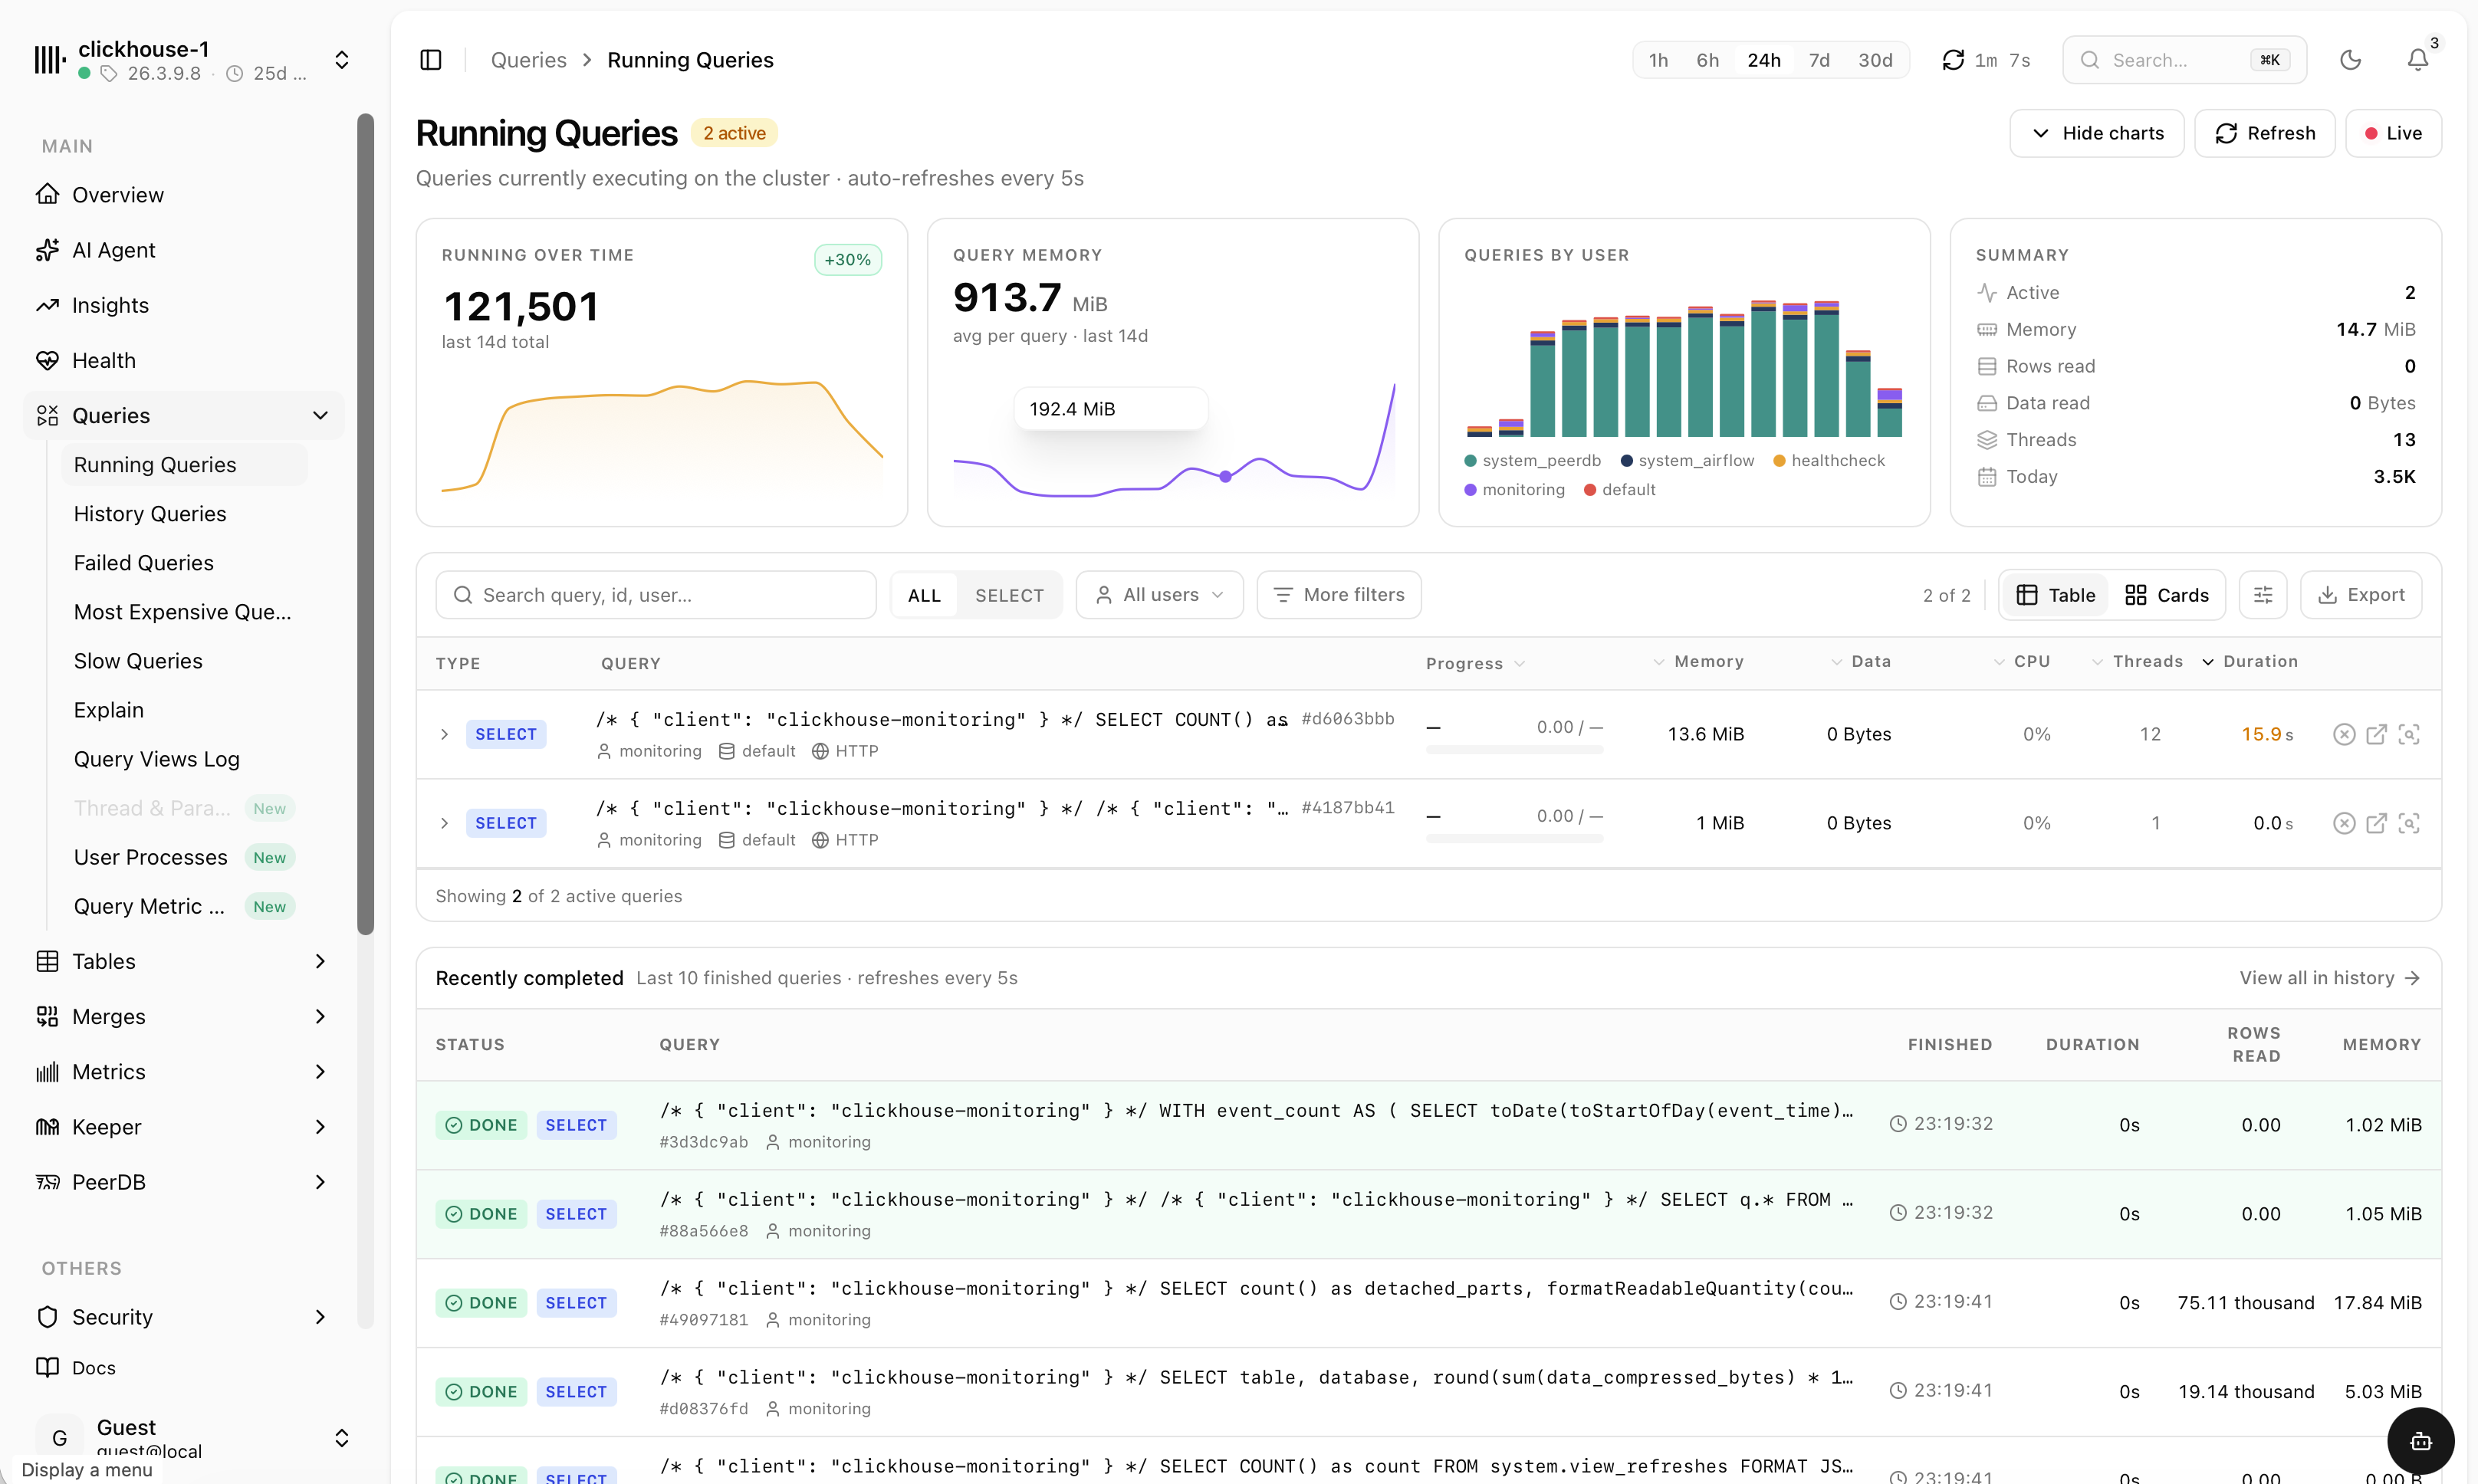
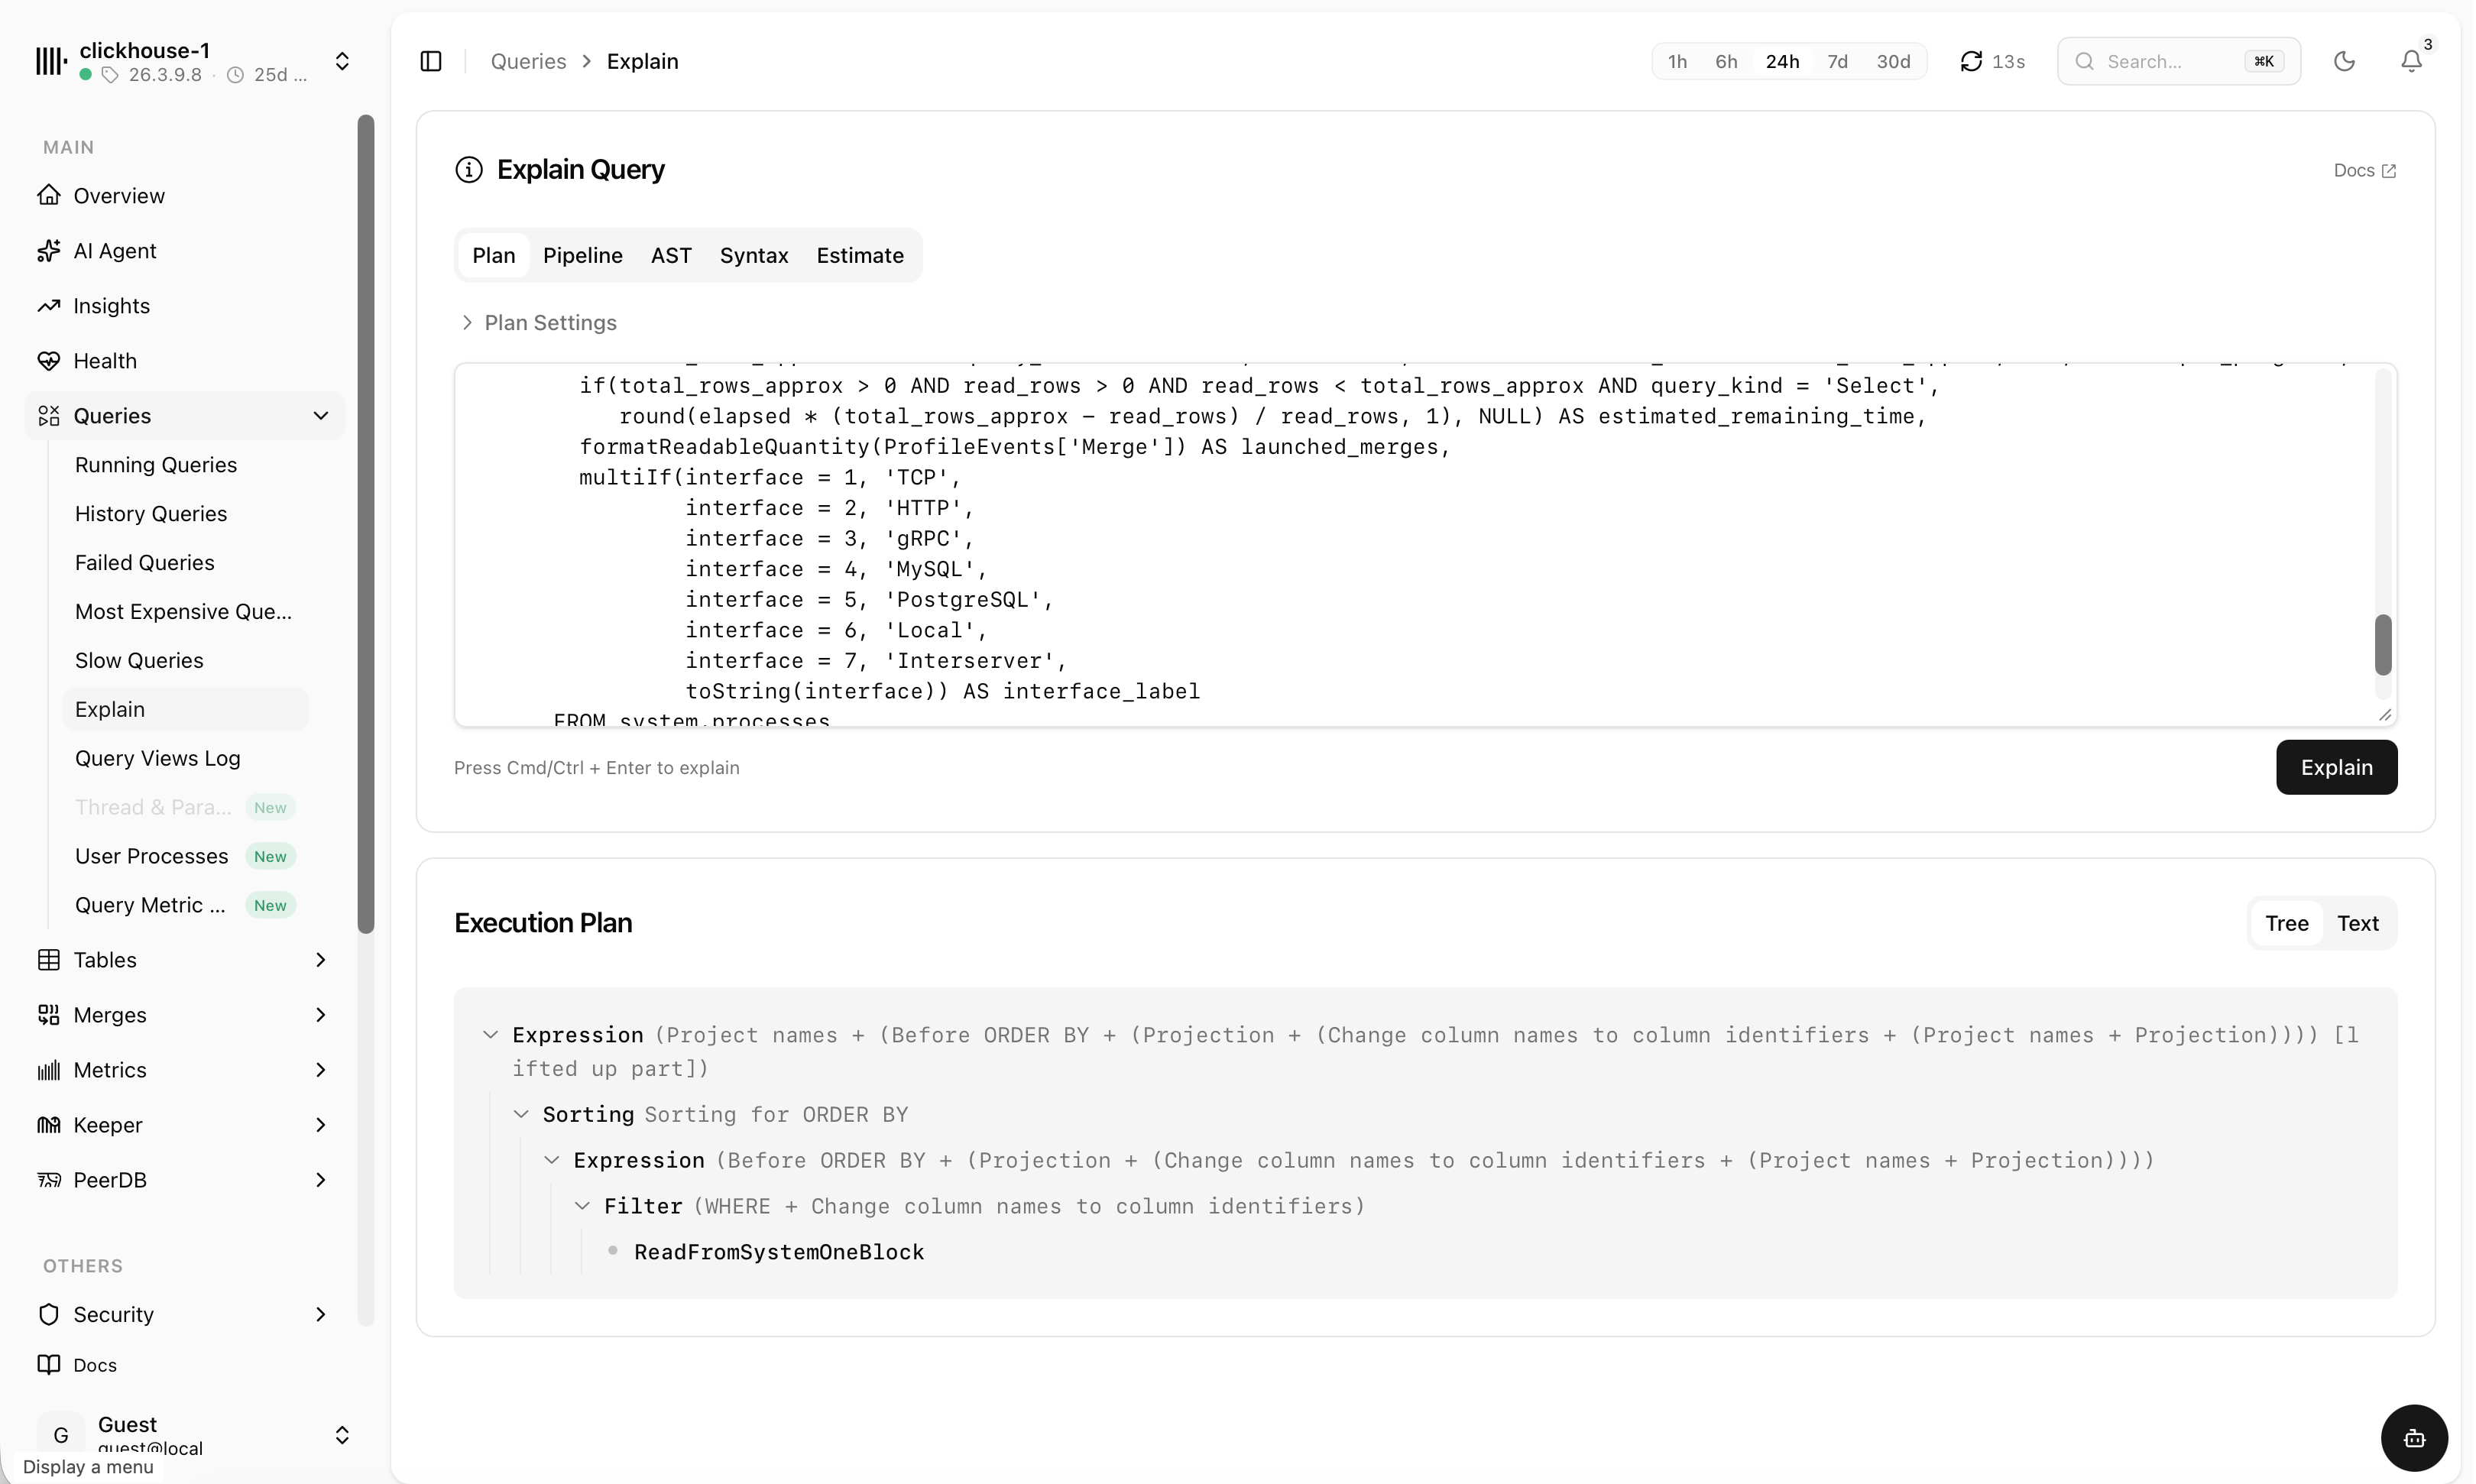
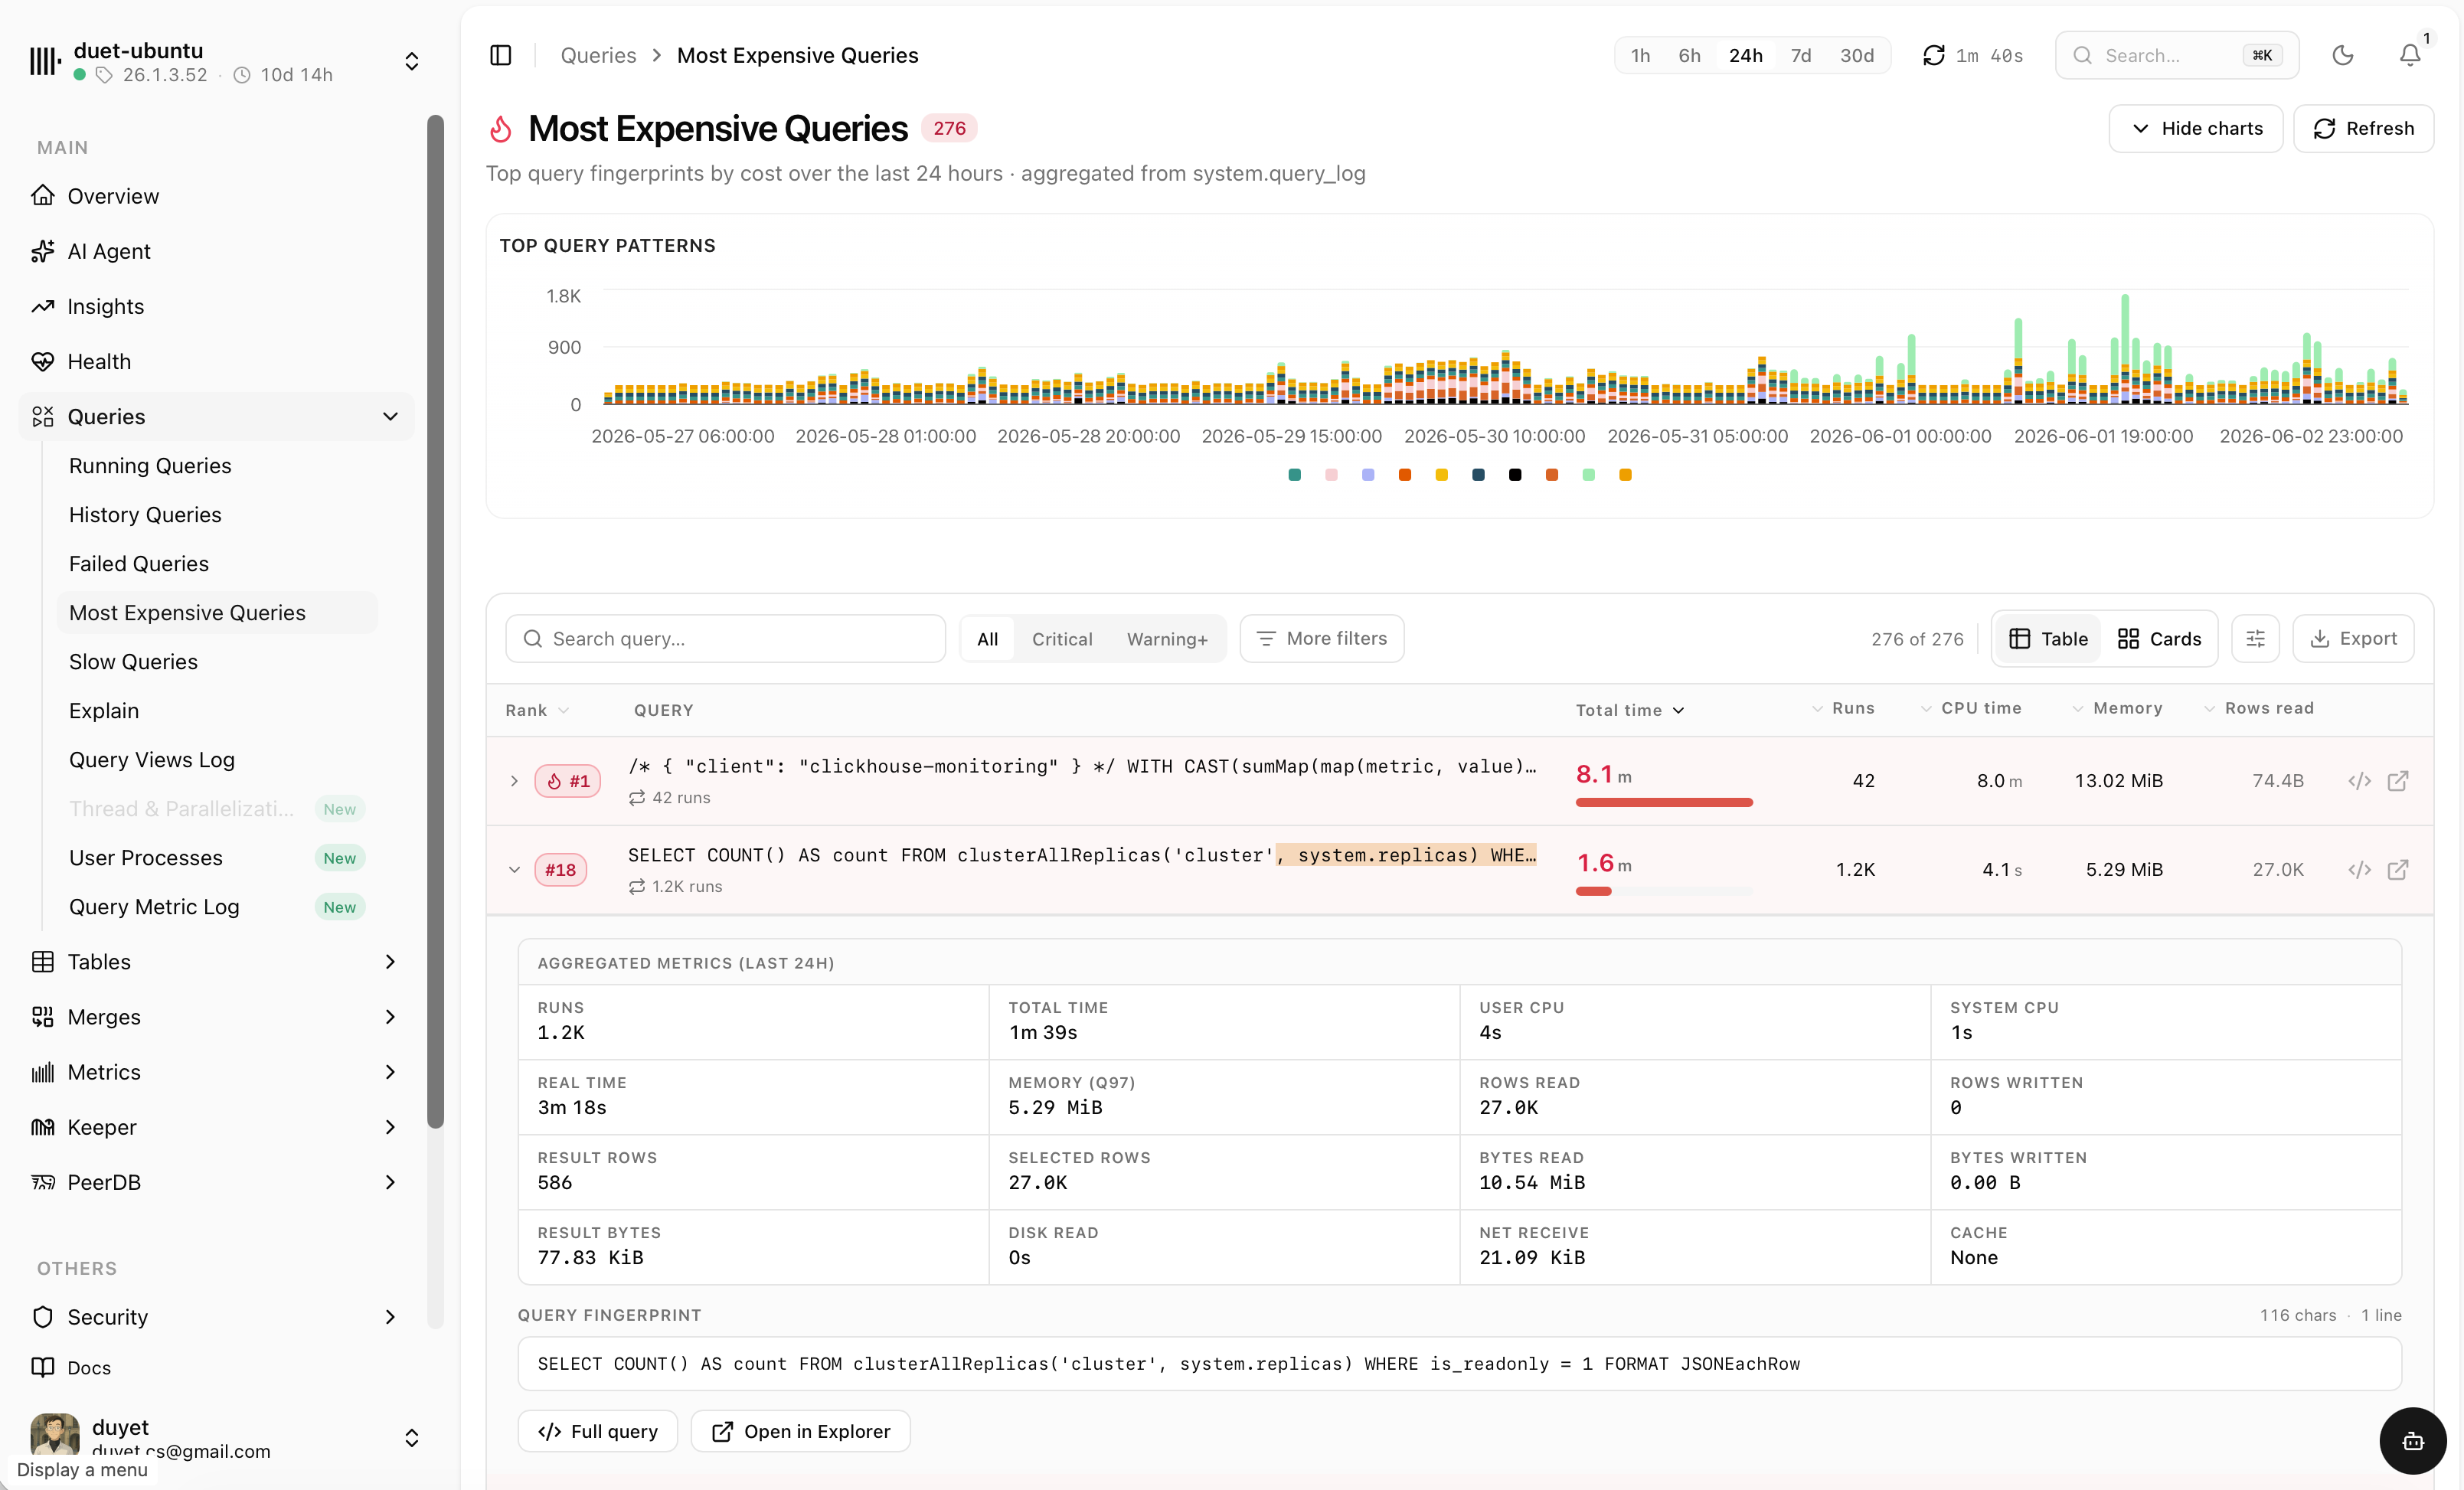
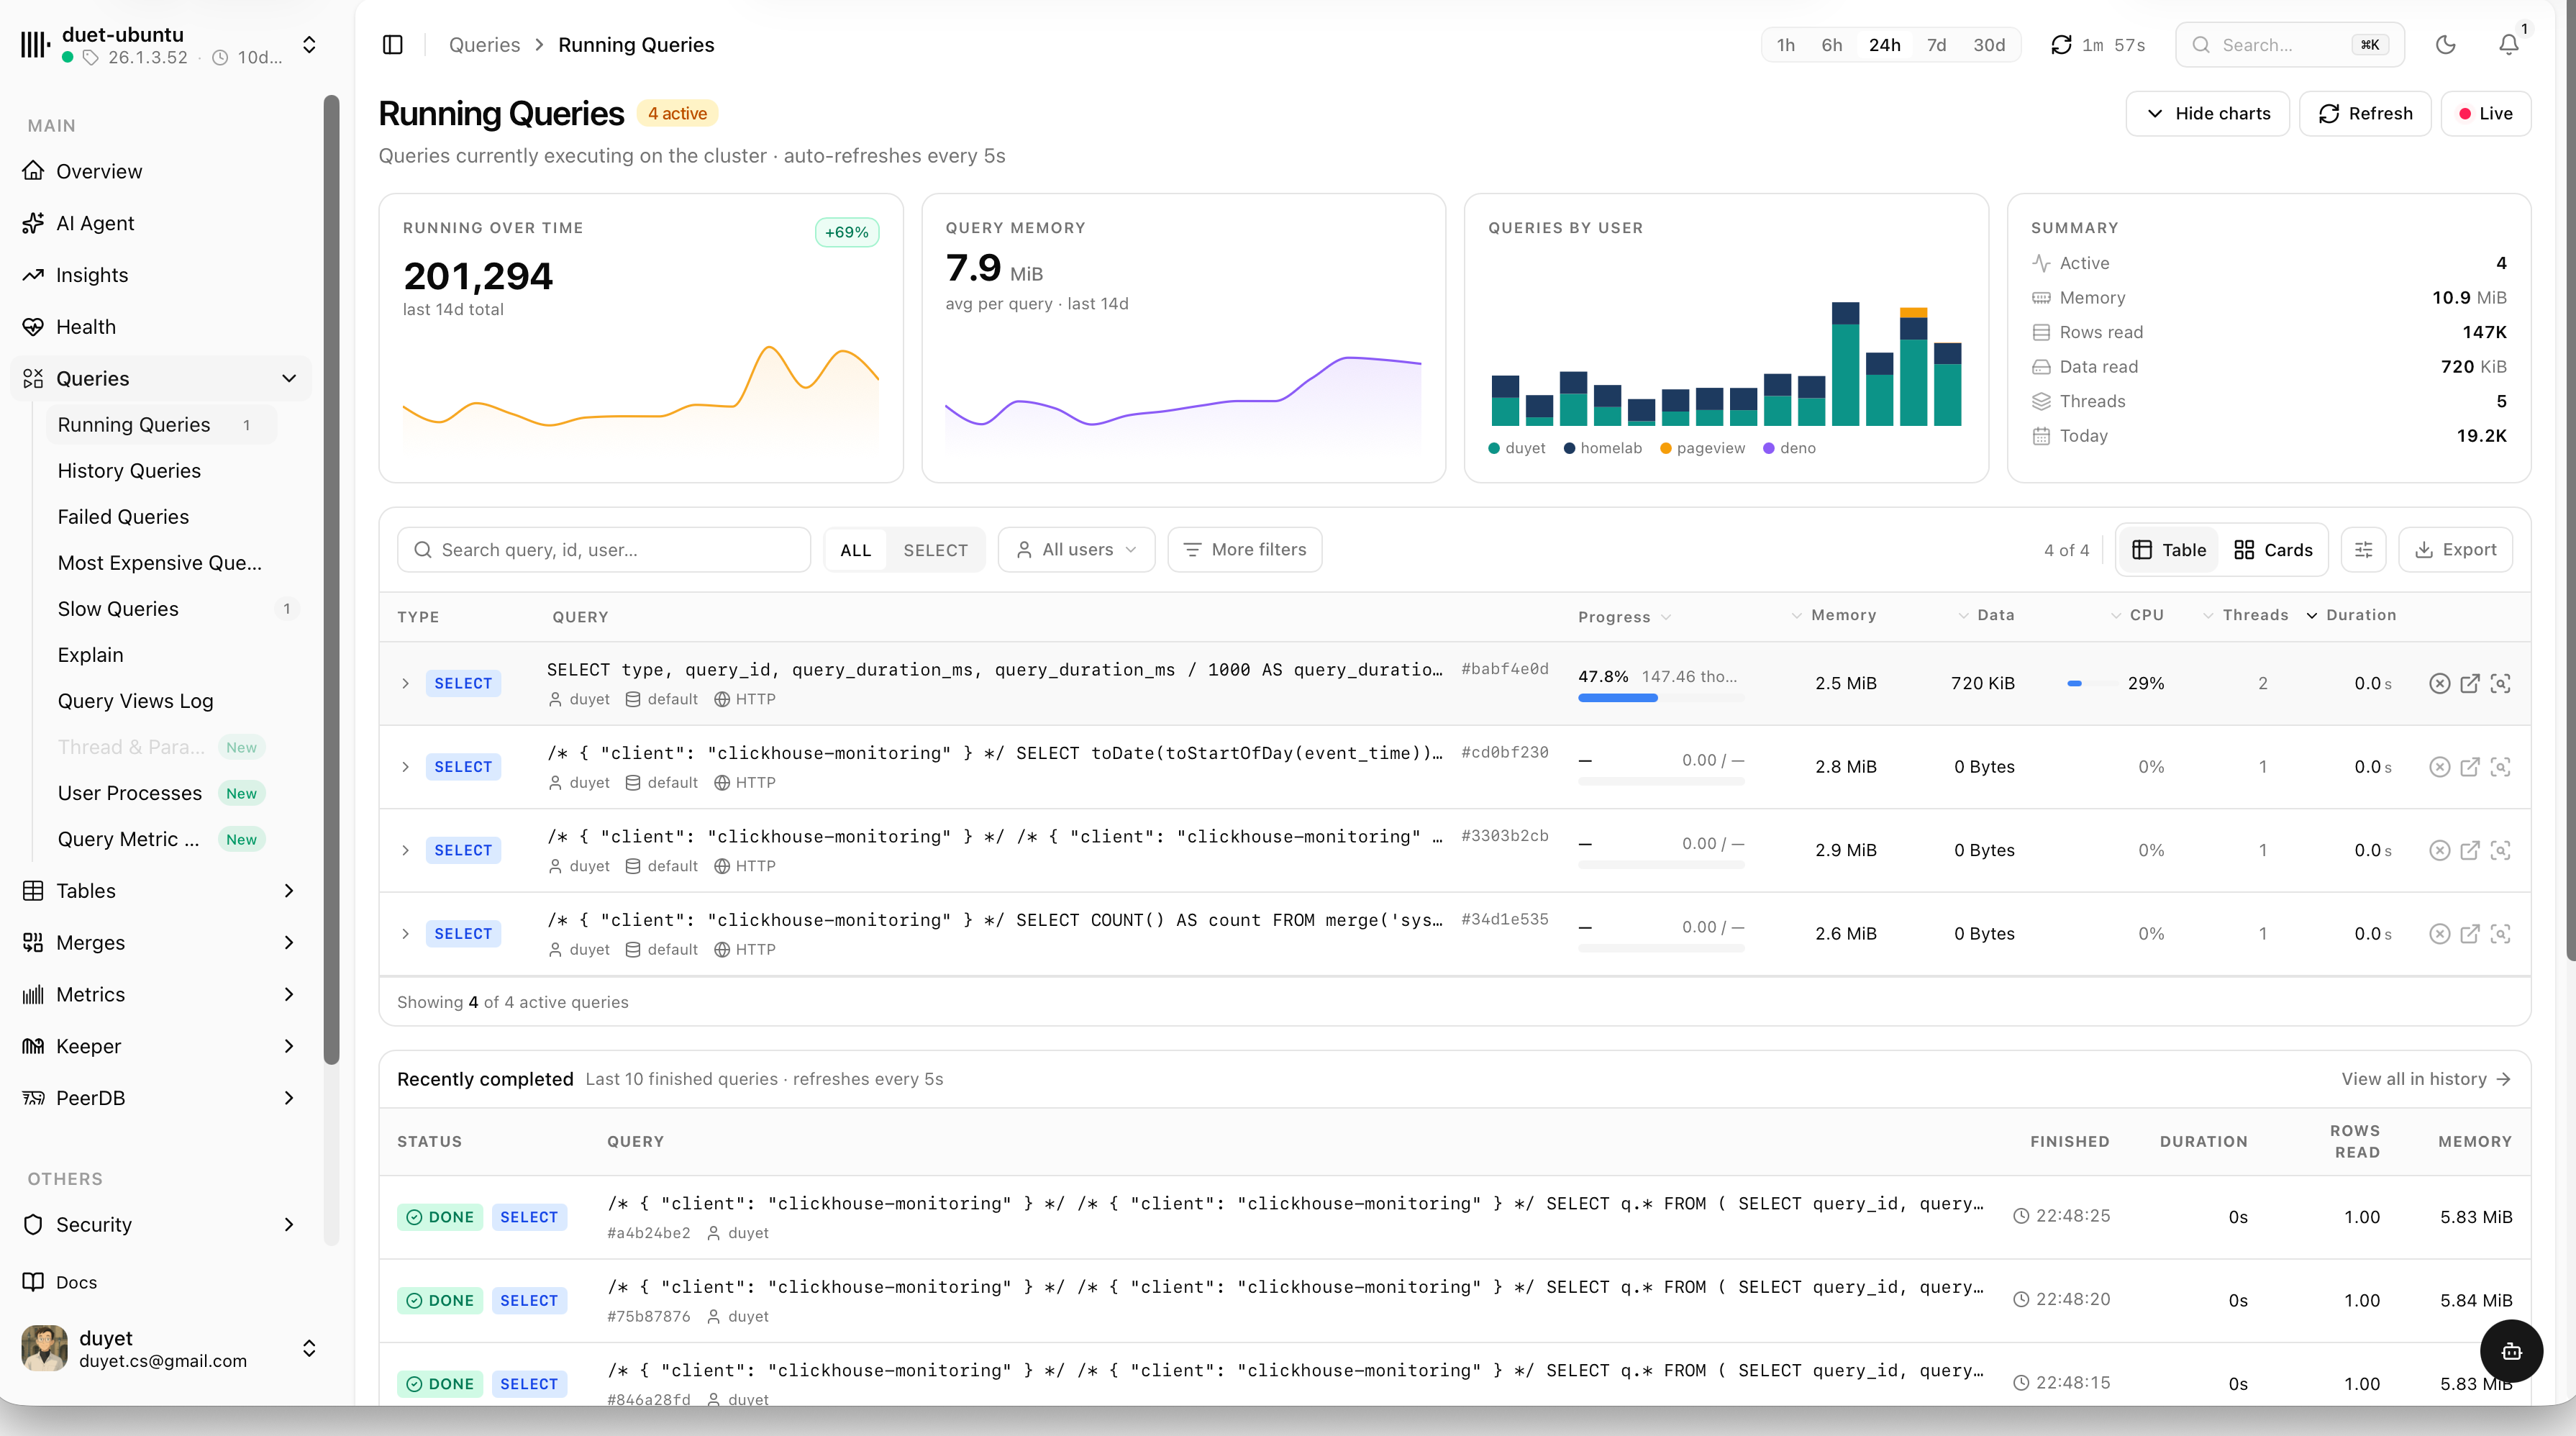
Every query, explained
Running, history, failed, slowest and most expensive queries — each with duration, memory, rows read and the full statement. Filter by user, slice by time and find the culprit fast.
- Queries by user and top query patterns over time
- Saved filter presets and one-click EXPLAIN
- Kill long-running queries right from the table
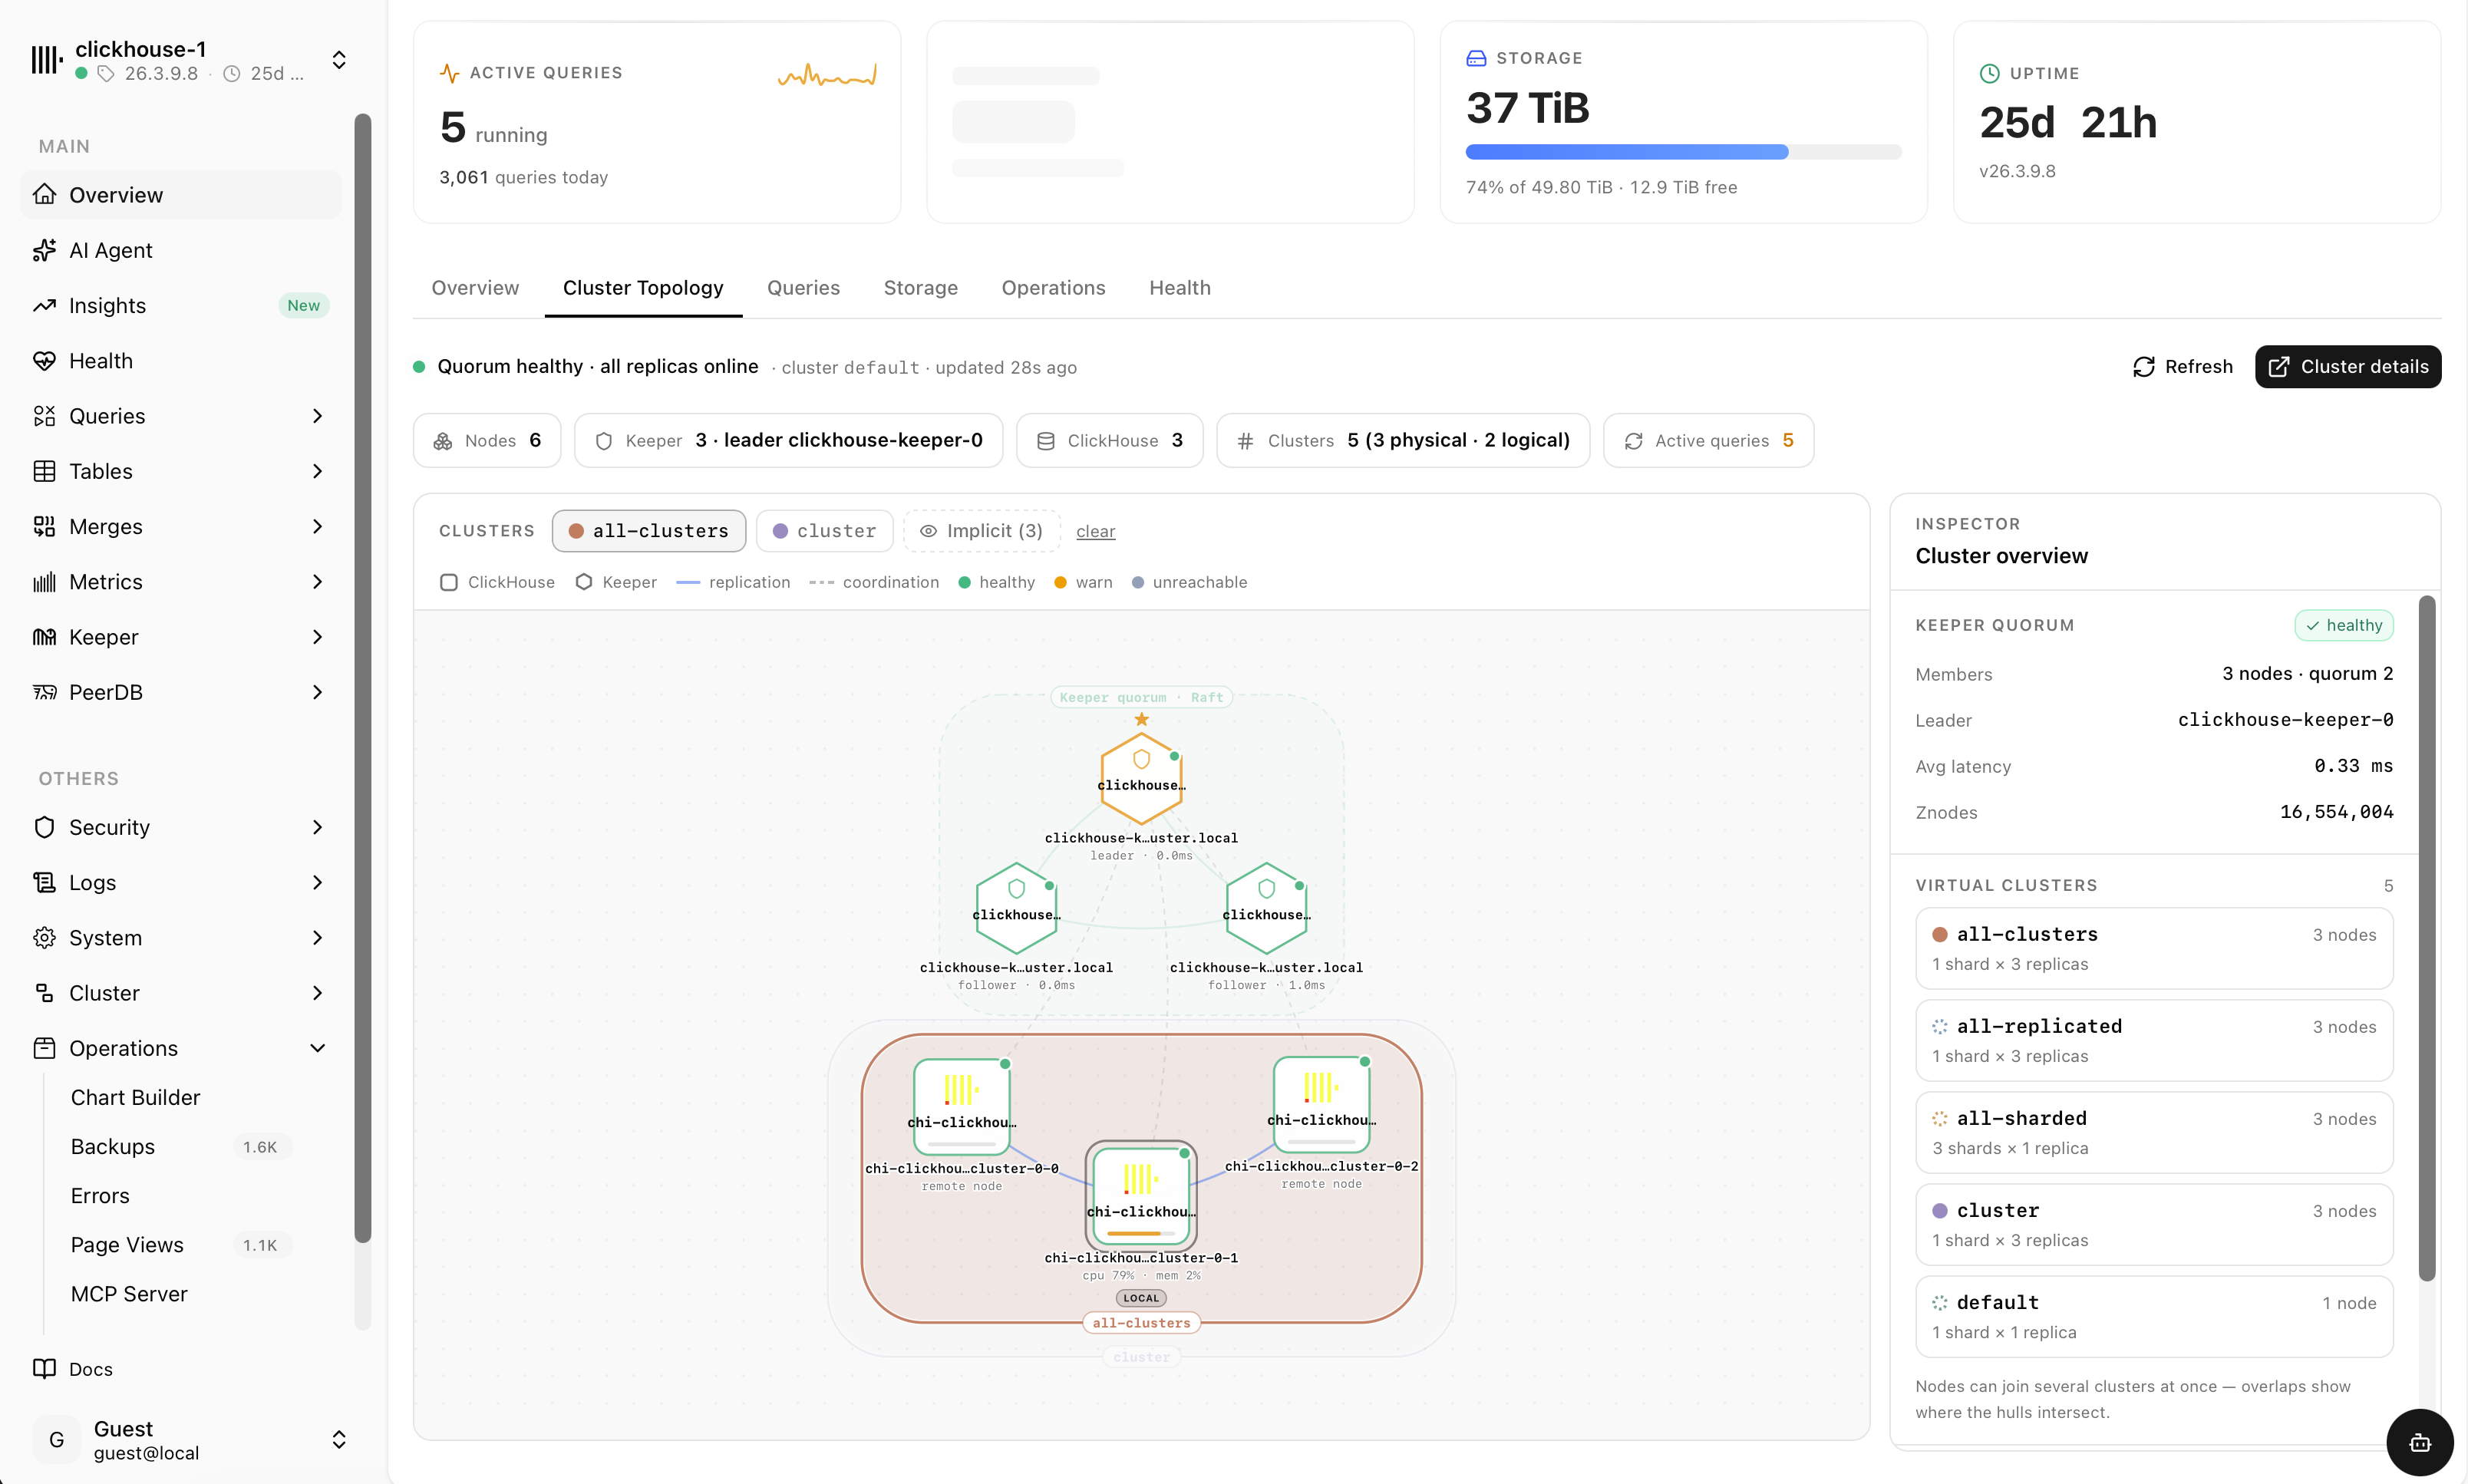
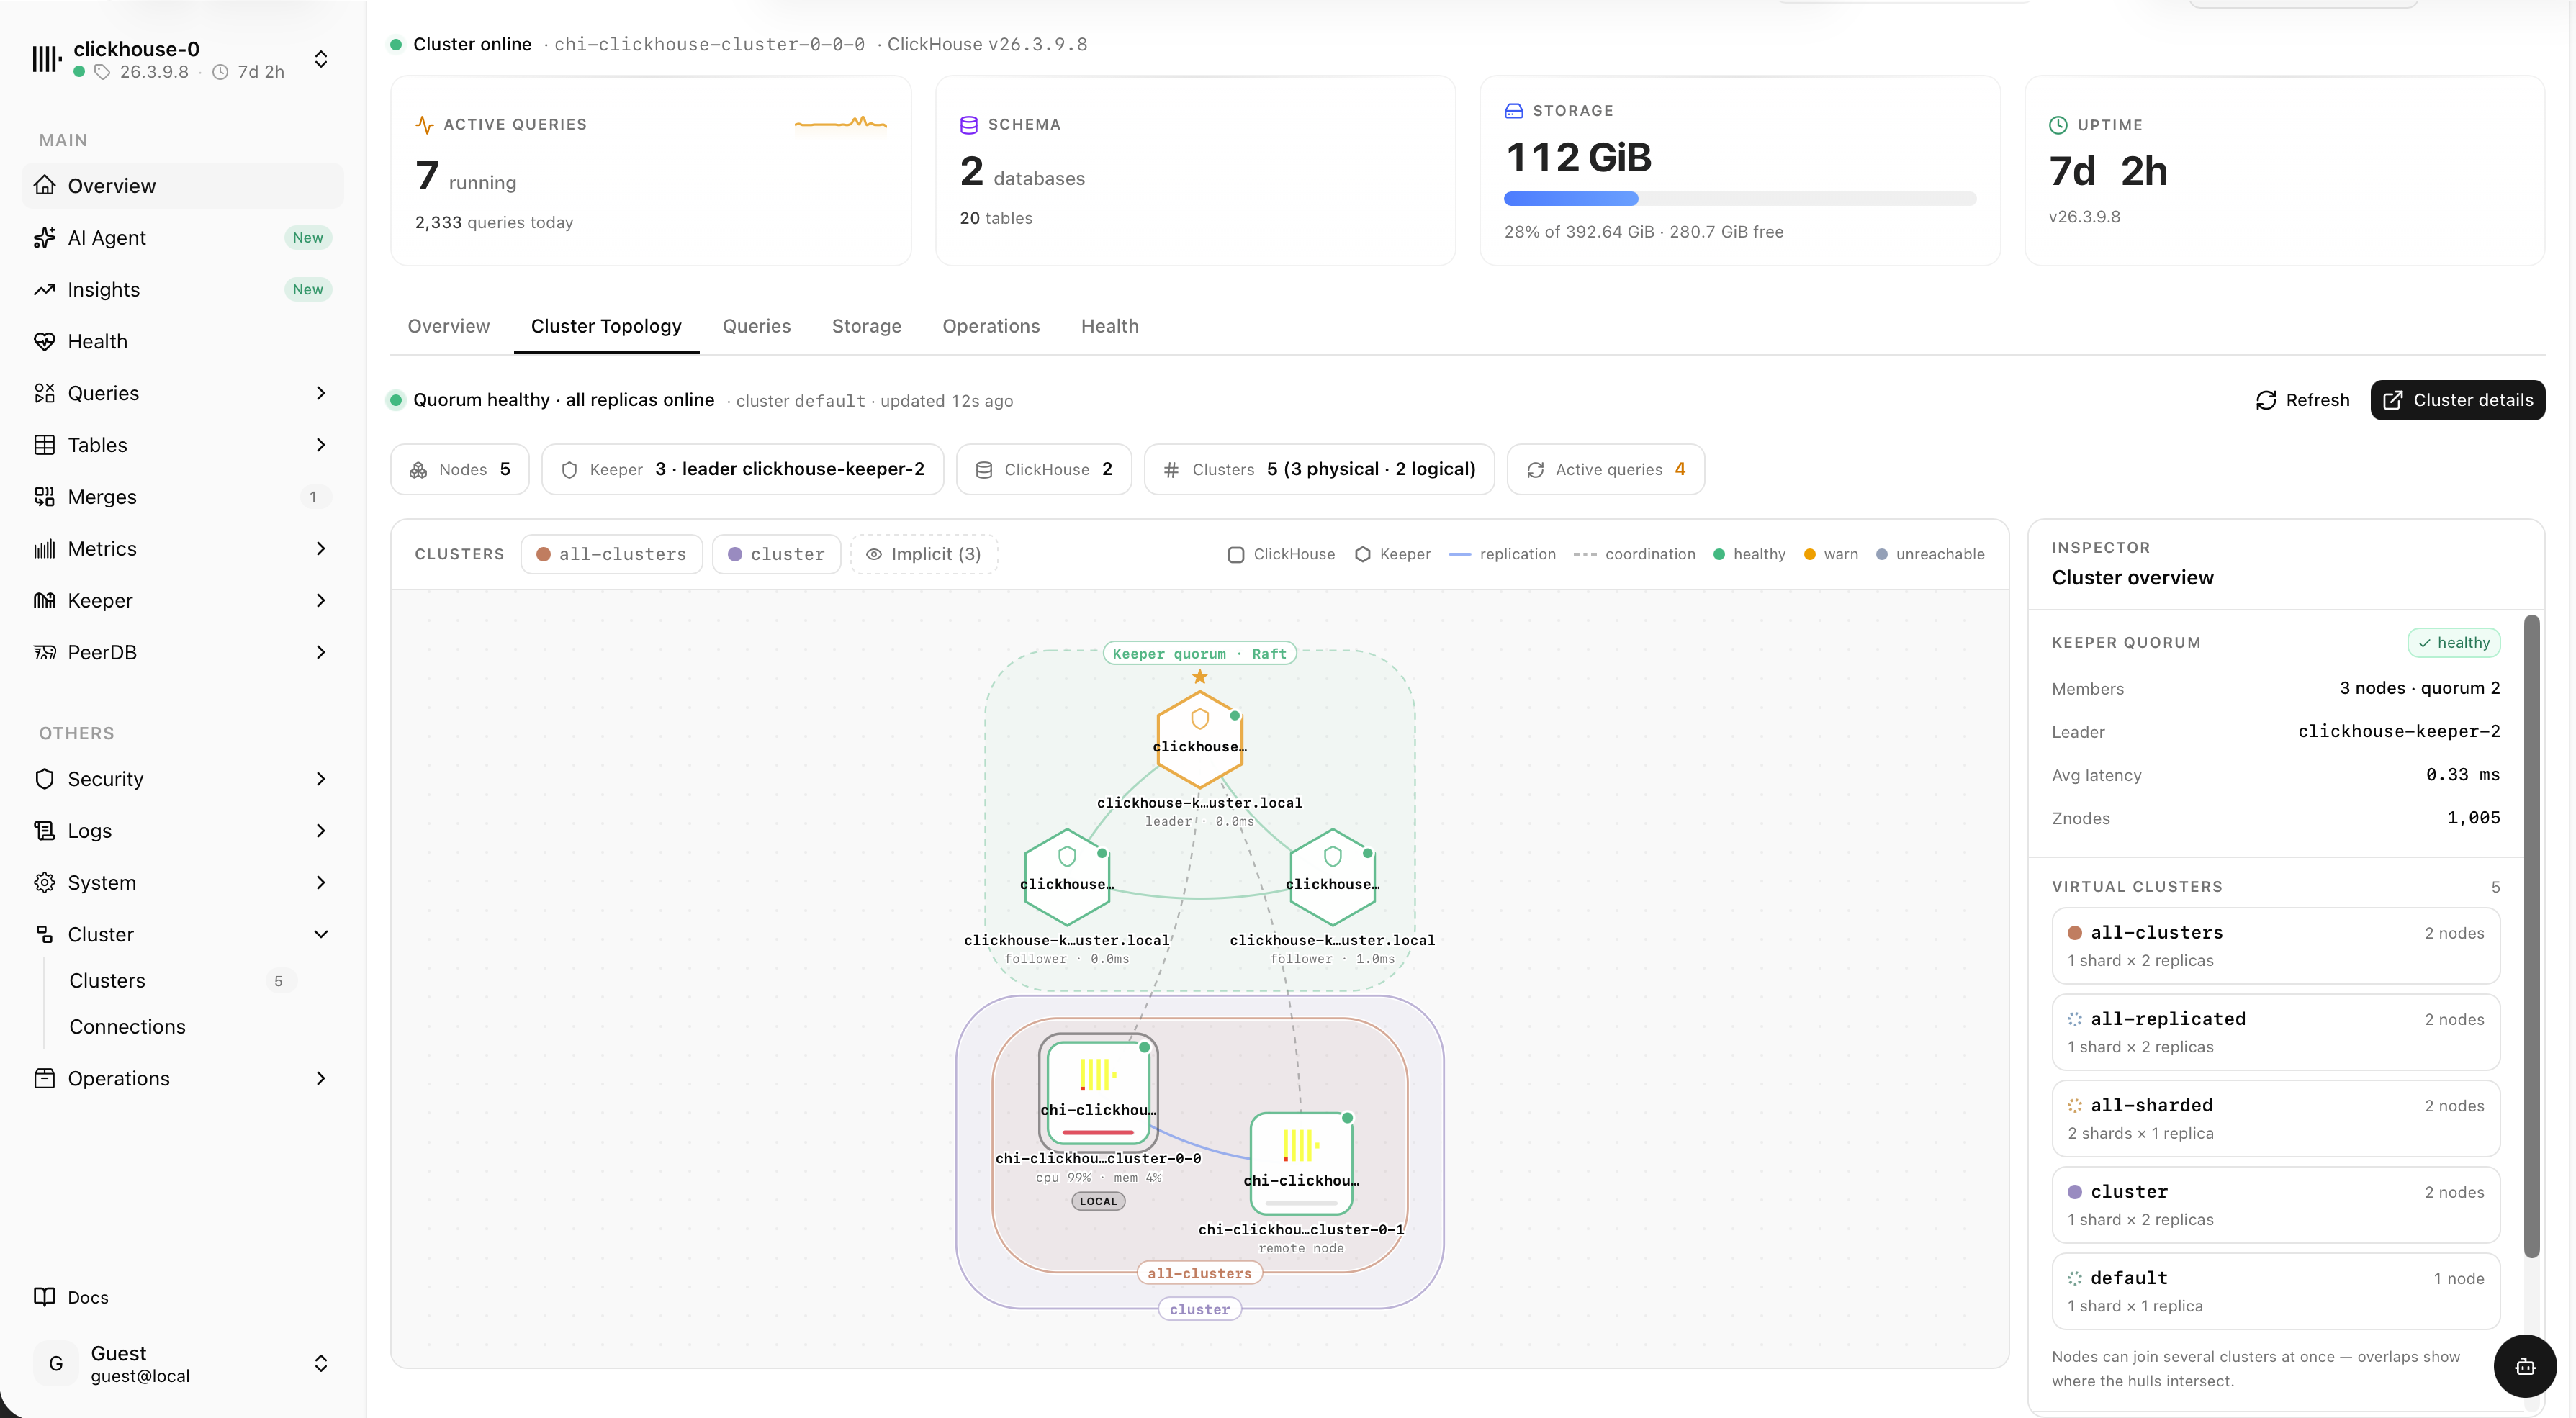
See the whole cluster at a glance
An interactive topology map of nodes, shards, replicas and the Keeper quorum — with live replication and coordination links, health states and an inspector for every cluster.
- ClickHouse nodes and Keeper quorum with leader & followers
- Physical and logical clusters, overlapping virtual clusters
- Per-node CPU, memory and latency, healthy / warn / unreachable
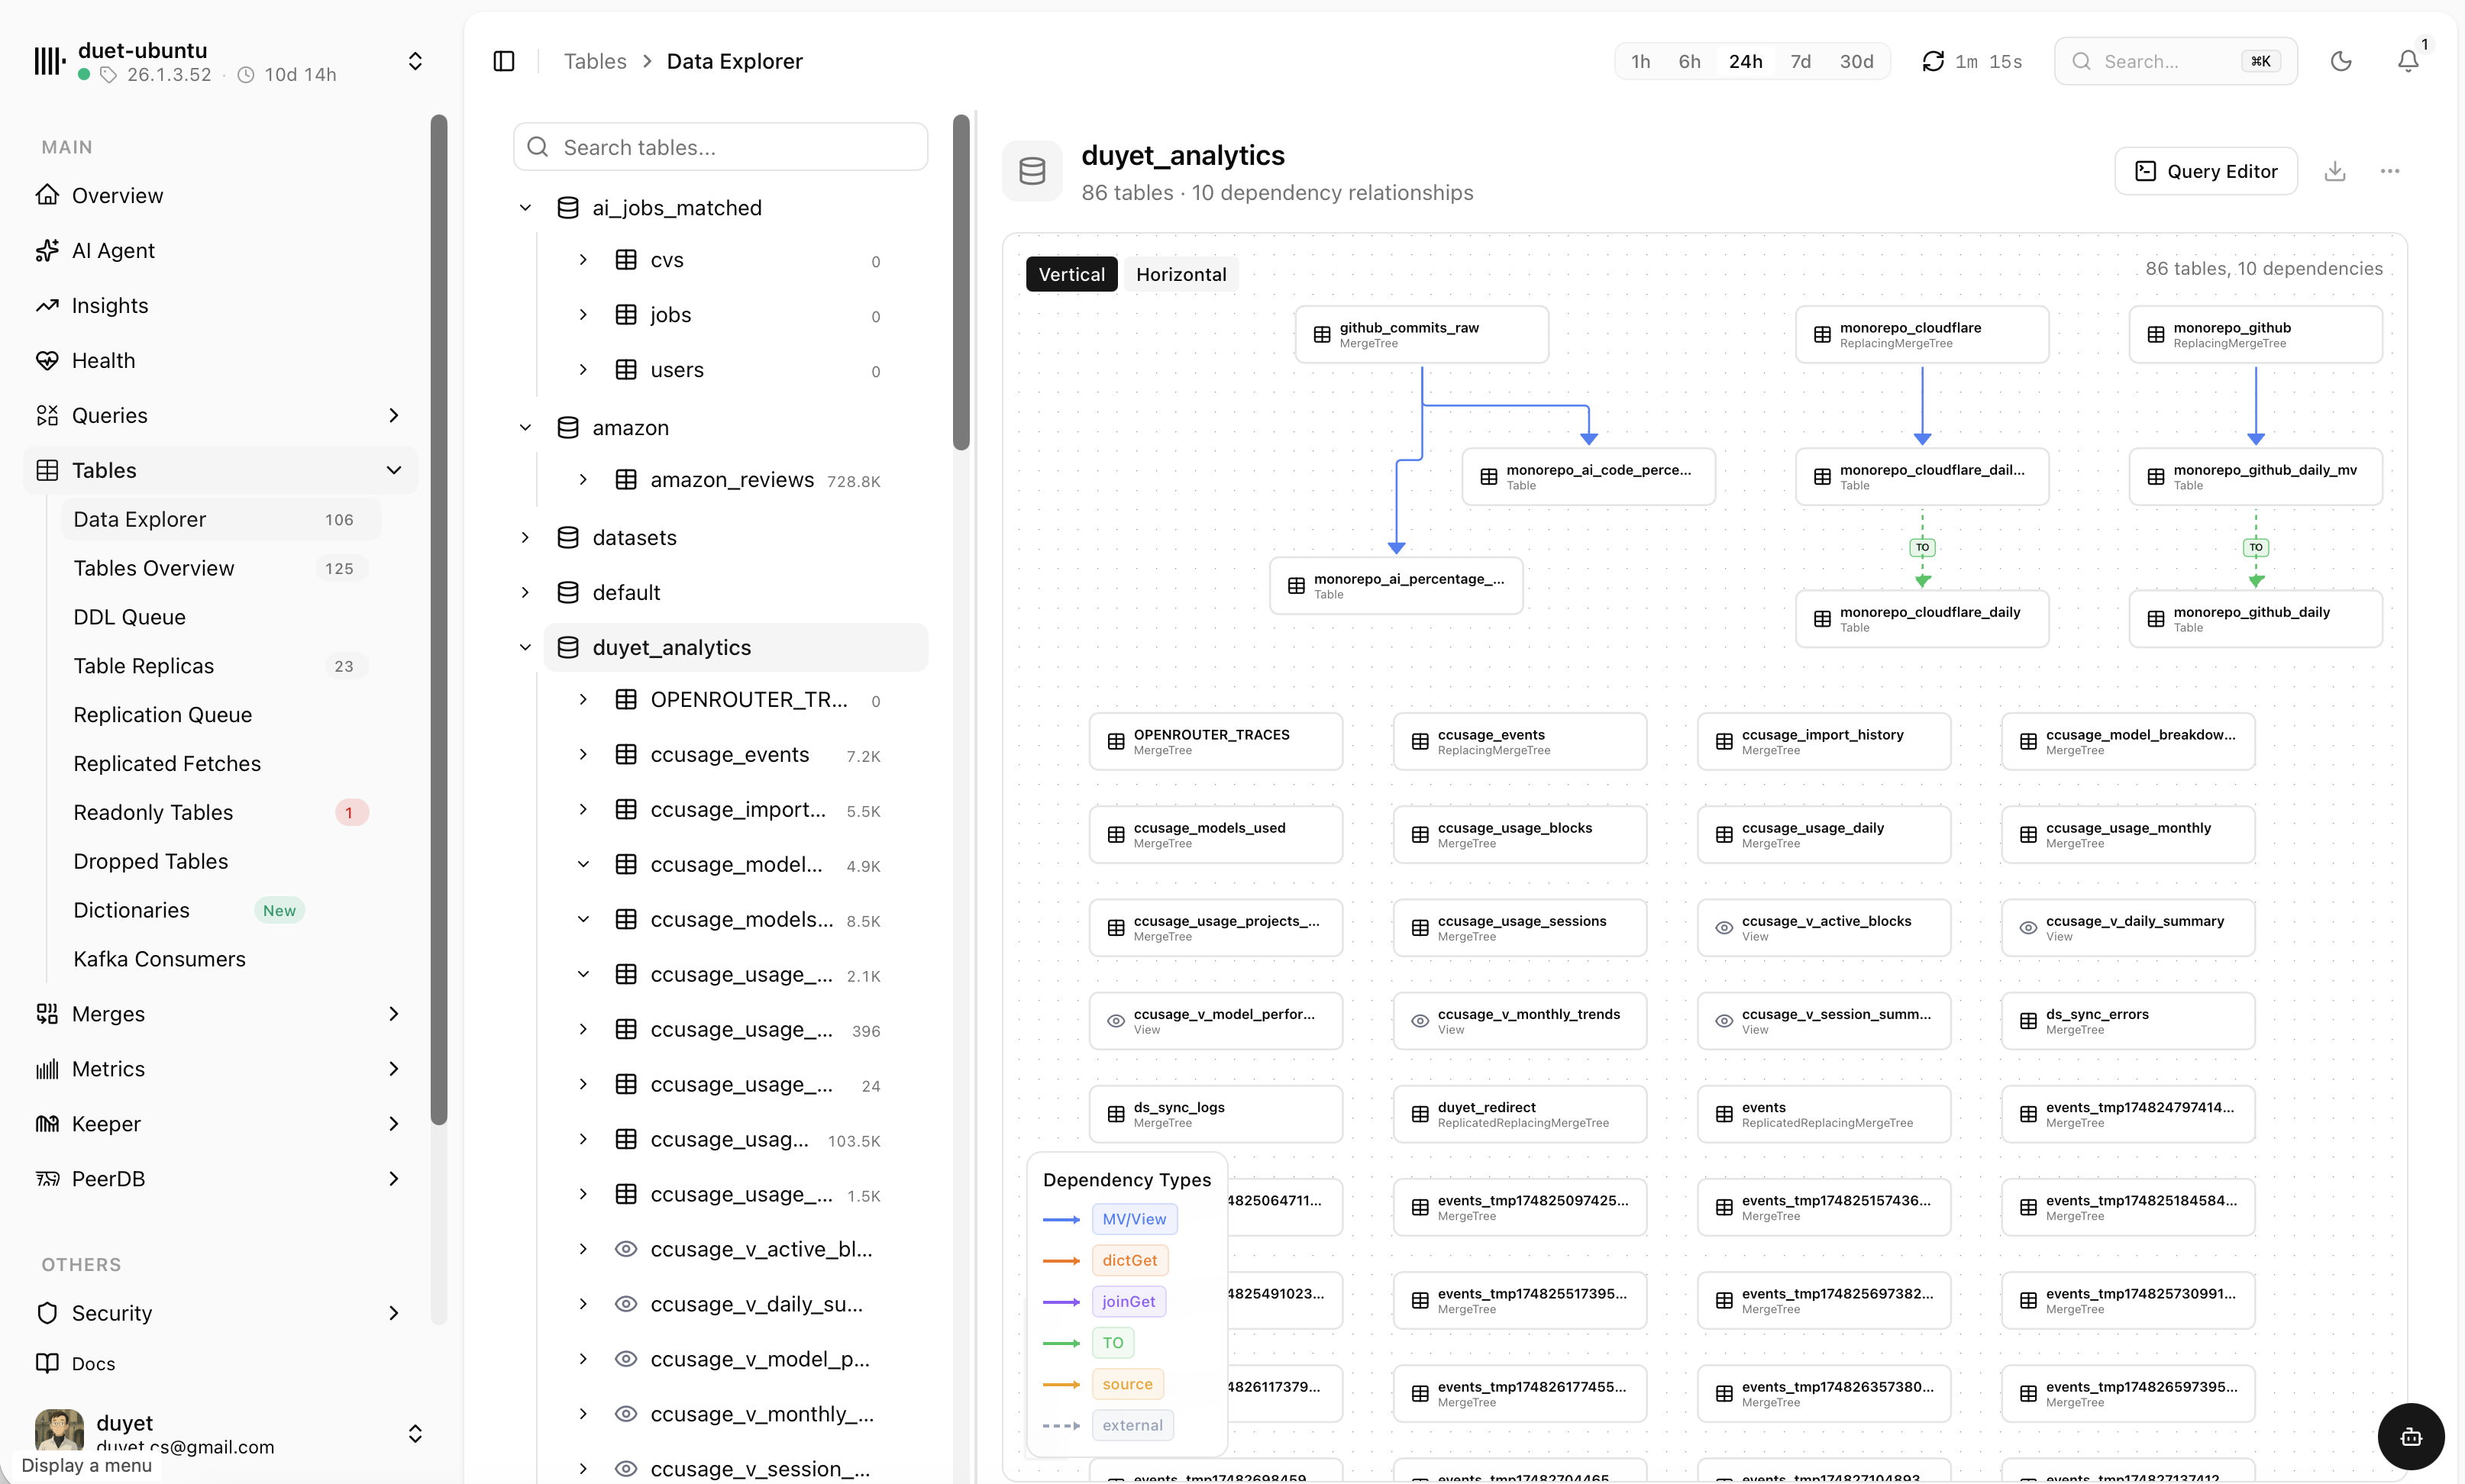
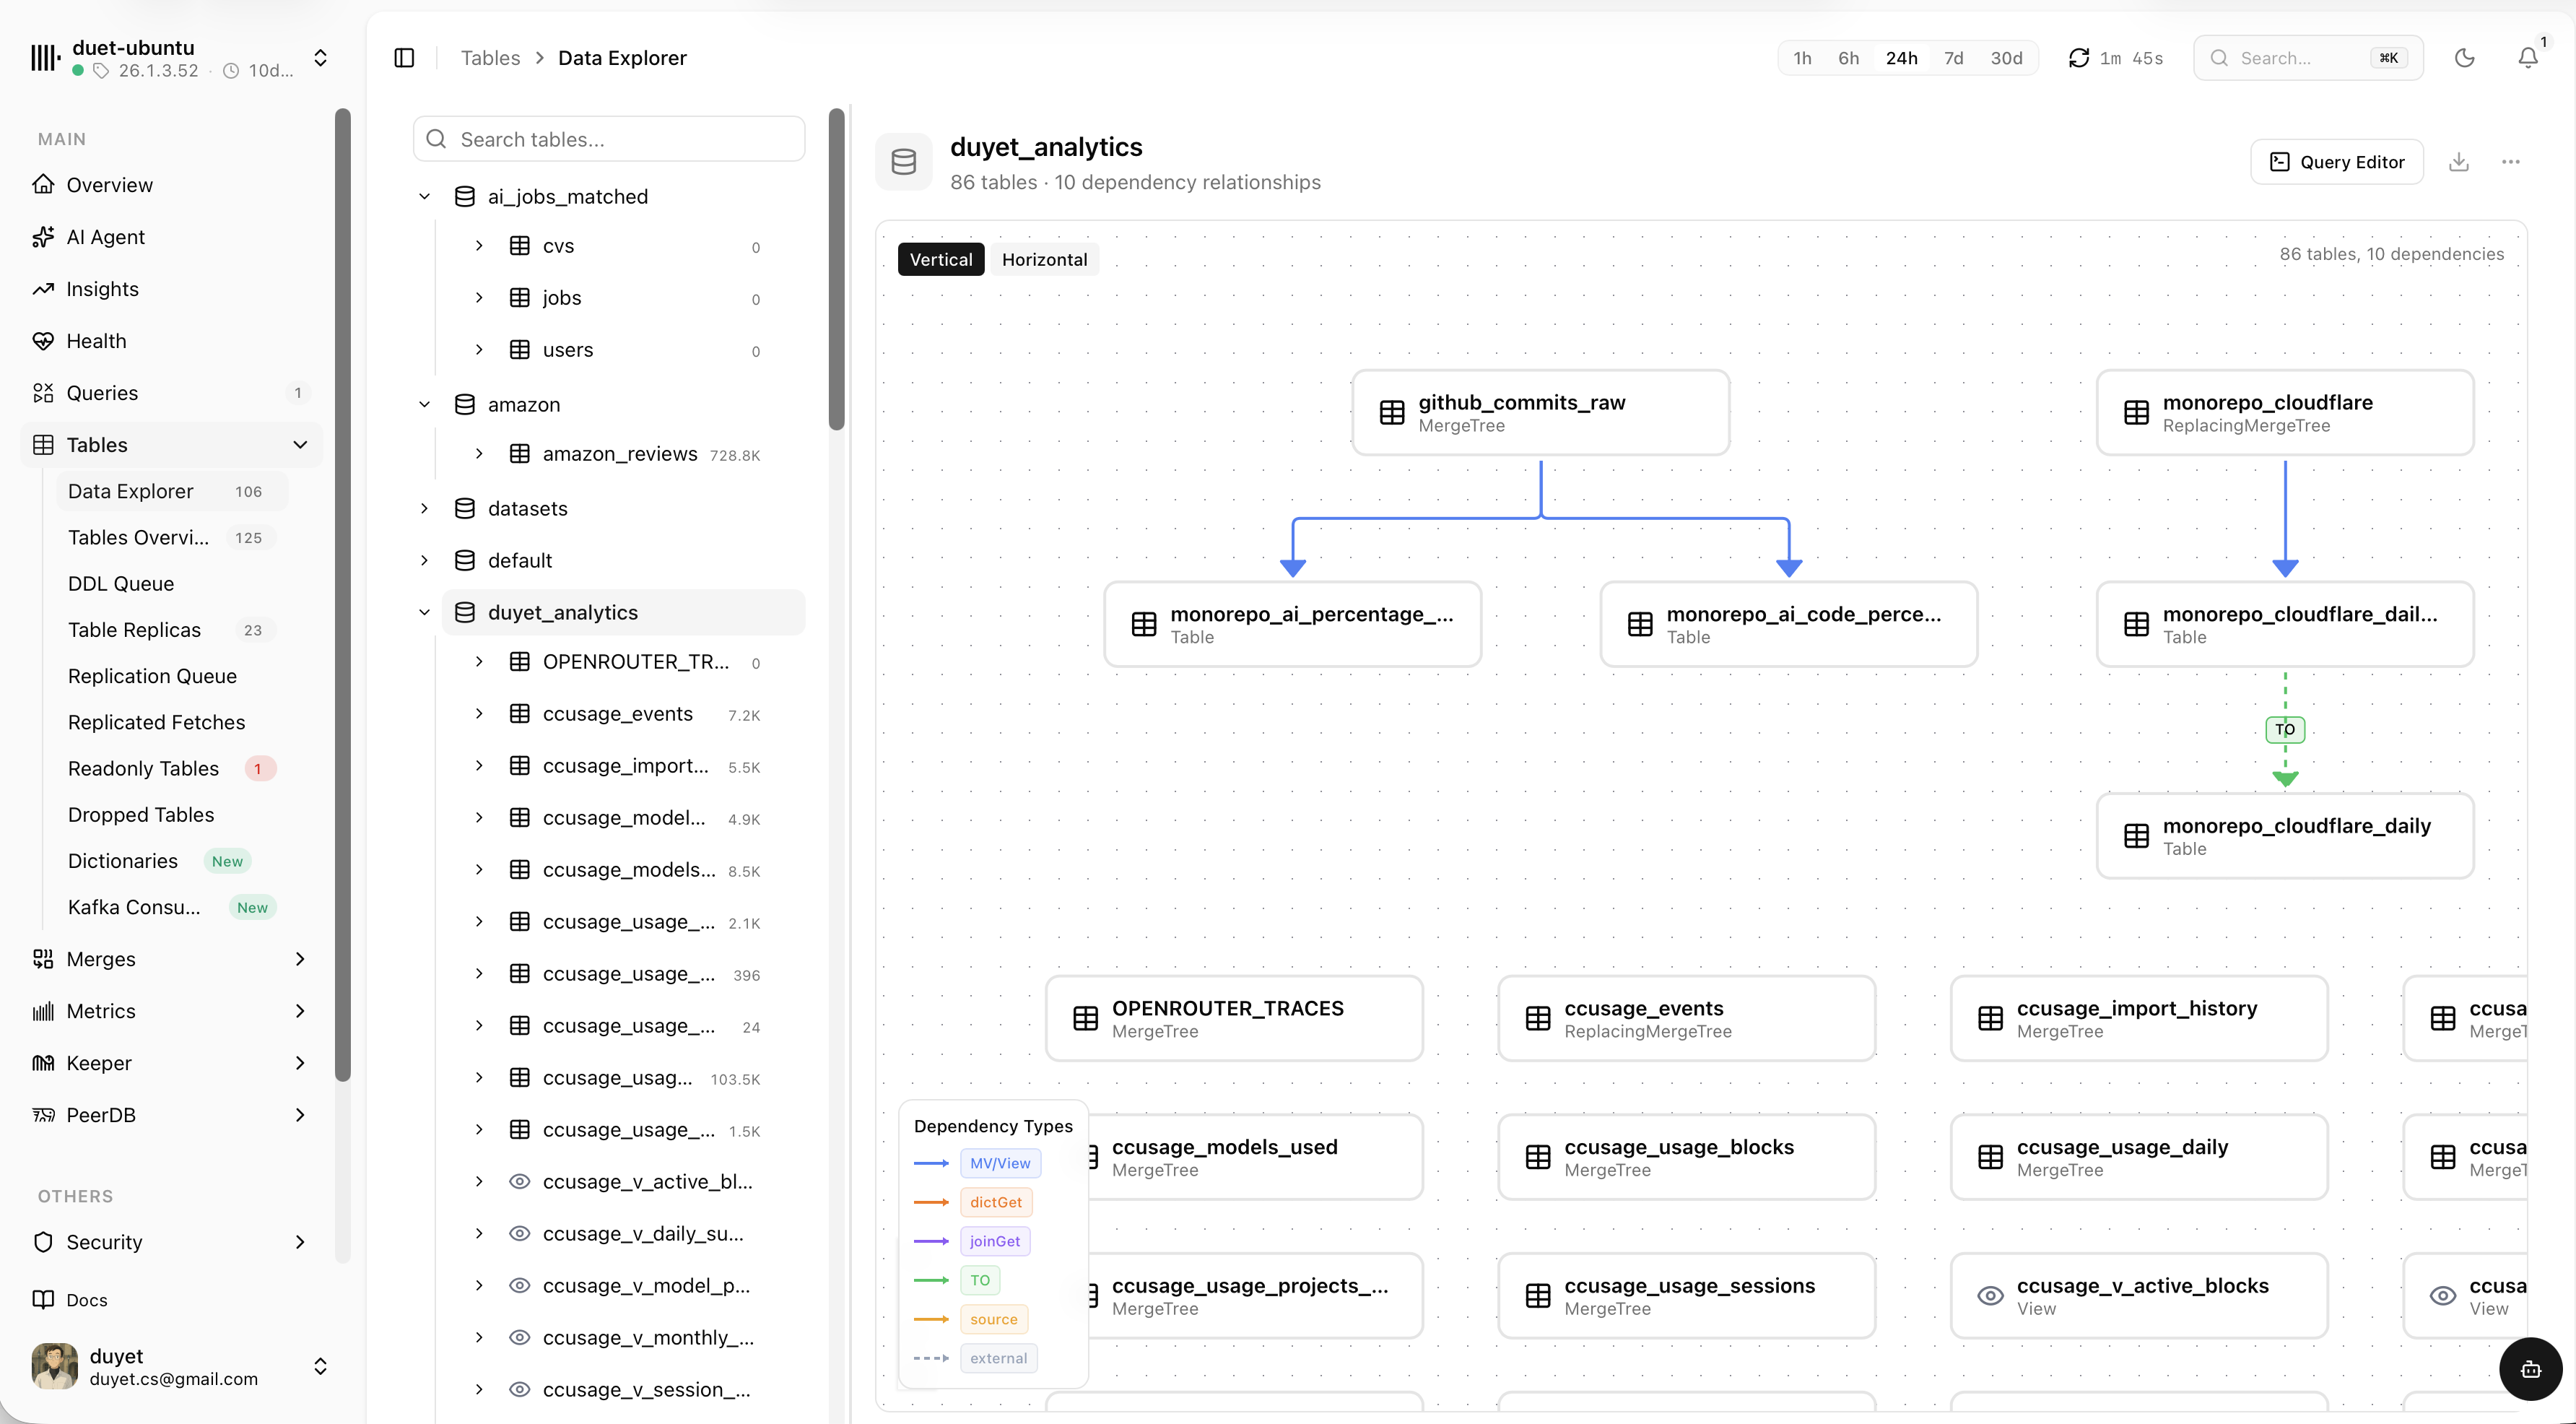
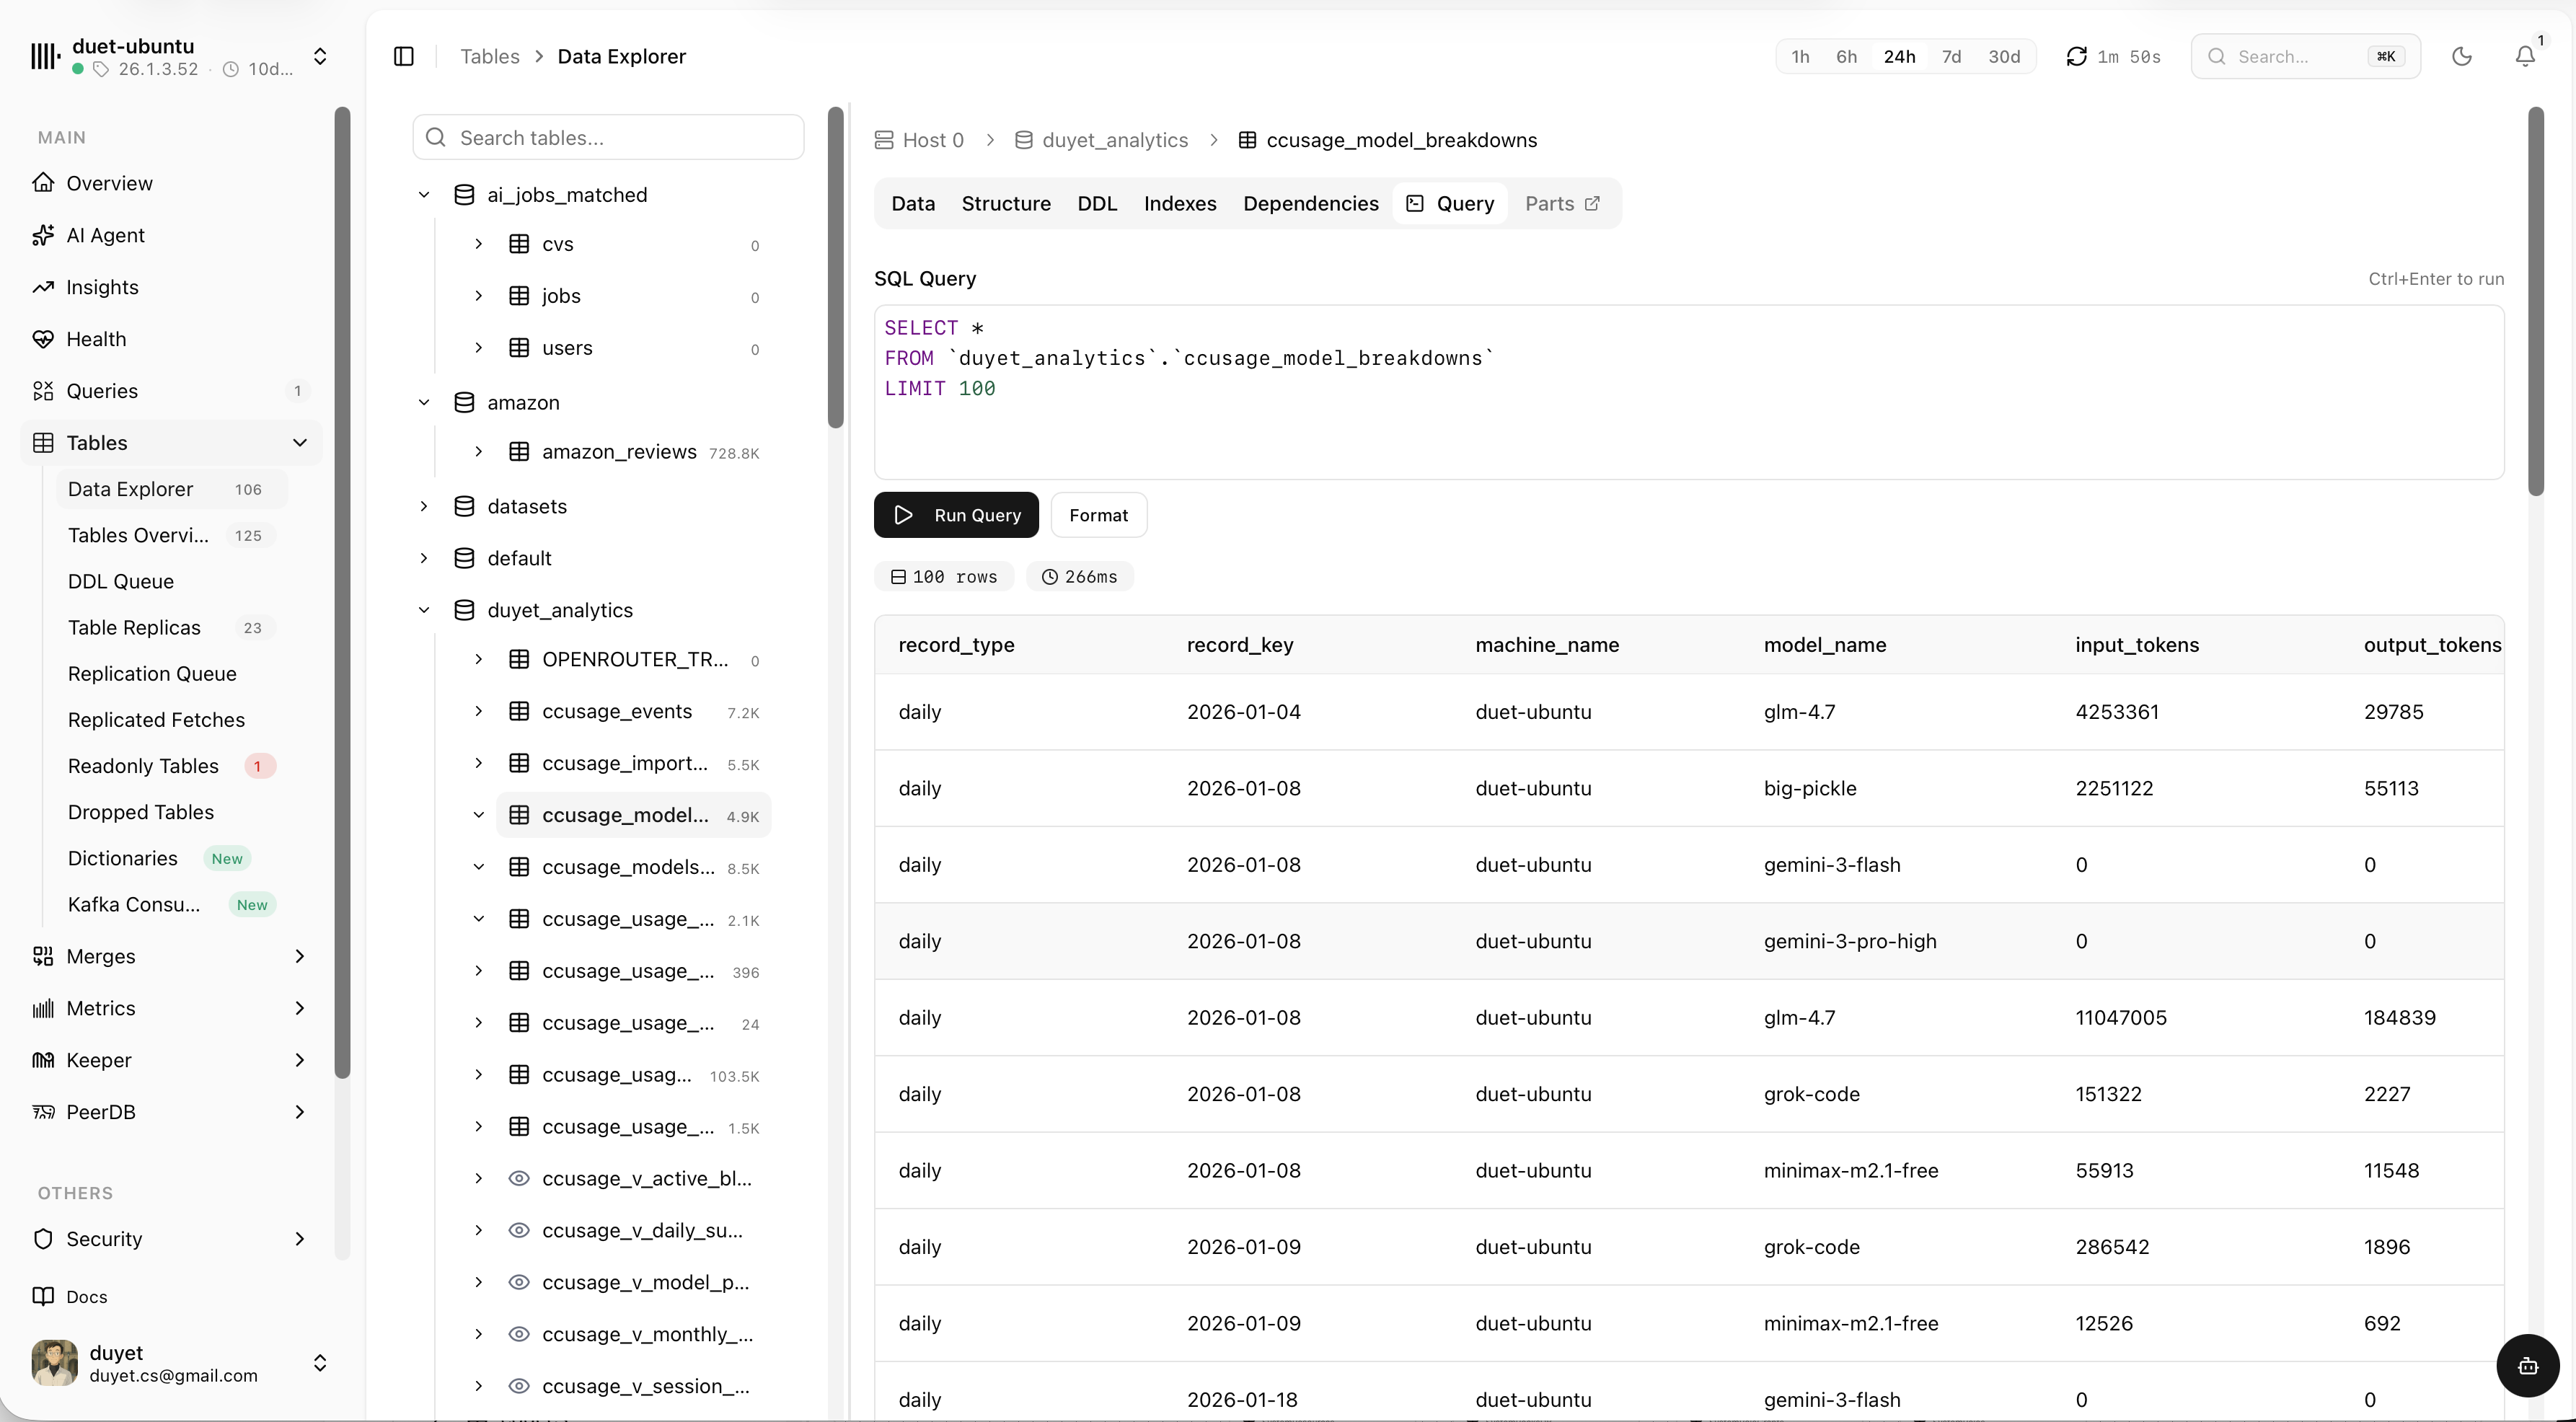
Explore tables and how they connect
Browse every database and table, map dependencies between them, then drop into a SQL editor to query the data — all without leaving the dashboard.
Catch issues early — then brief your agent to fix them
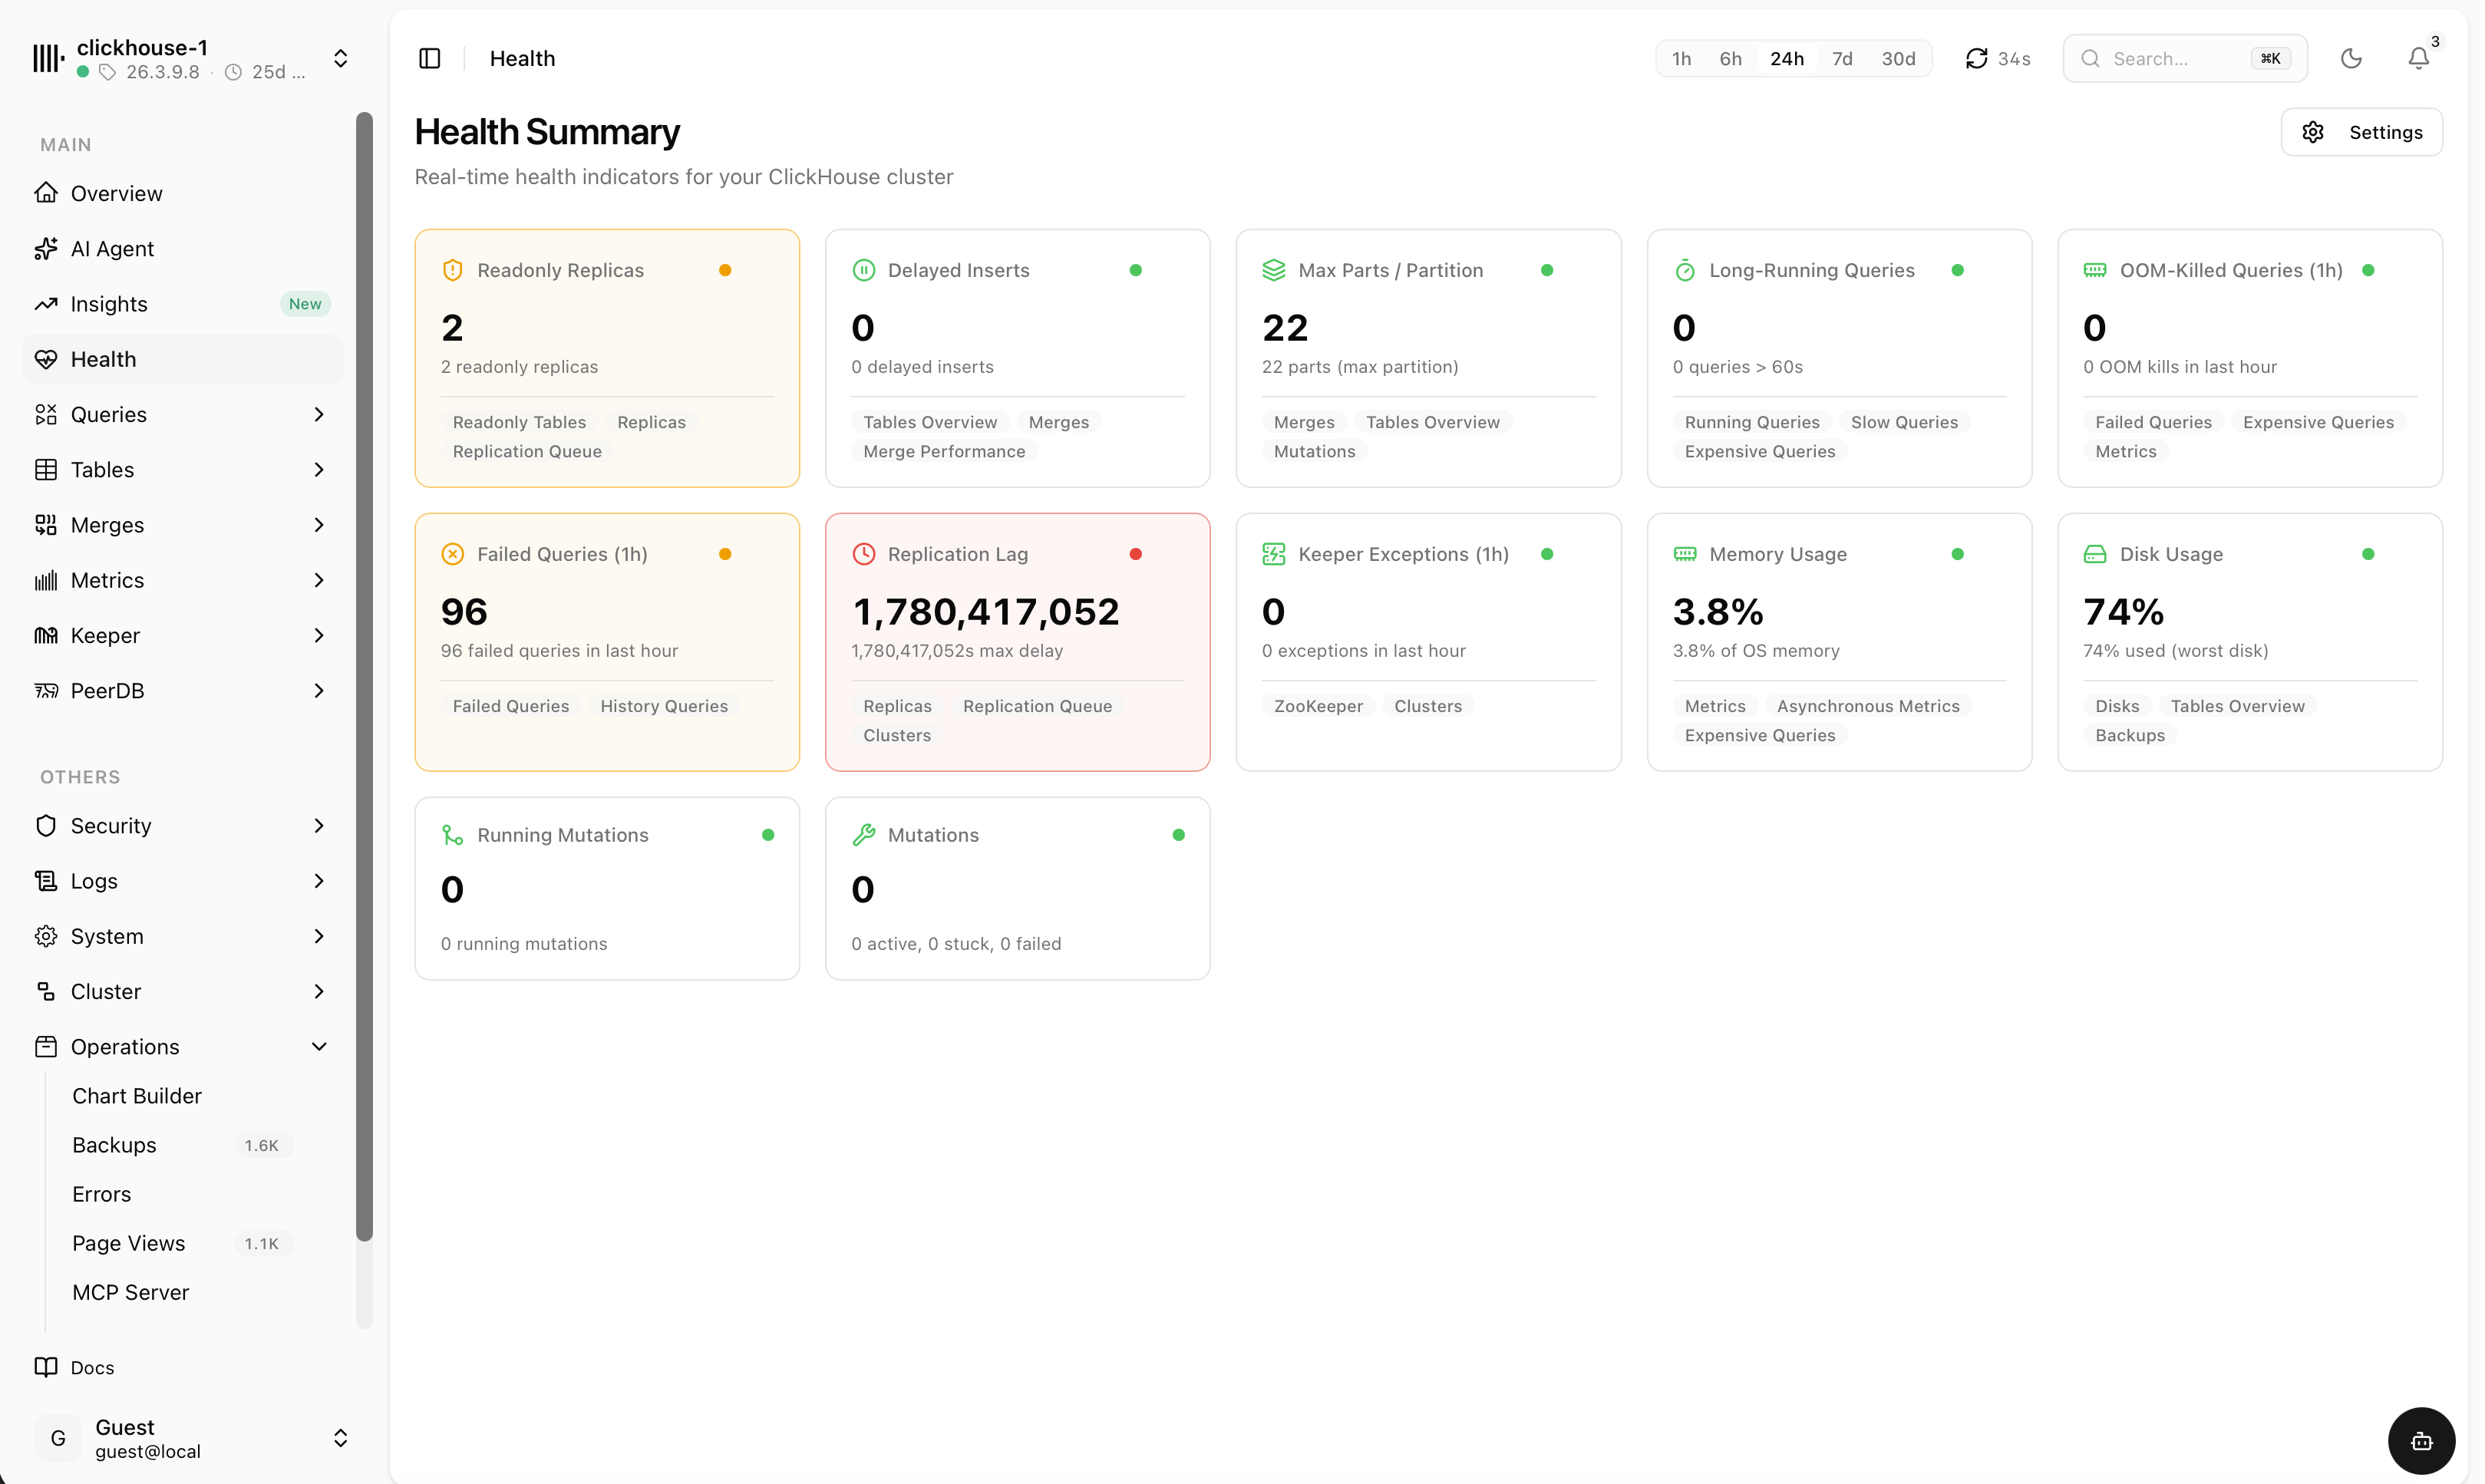
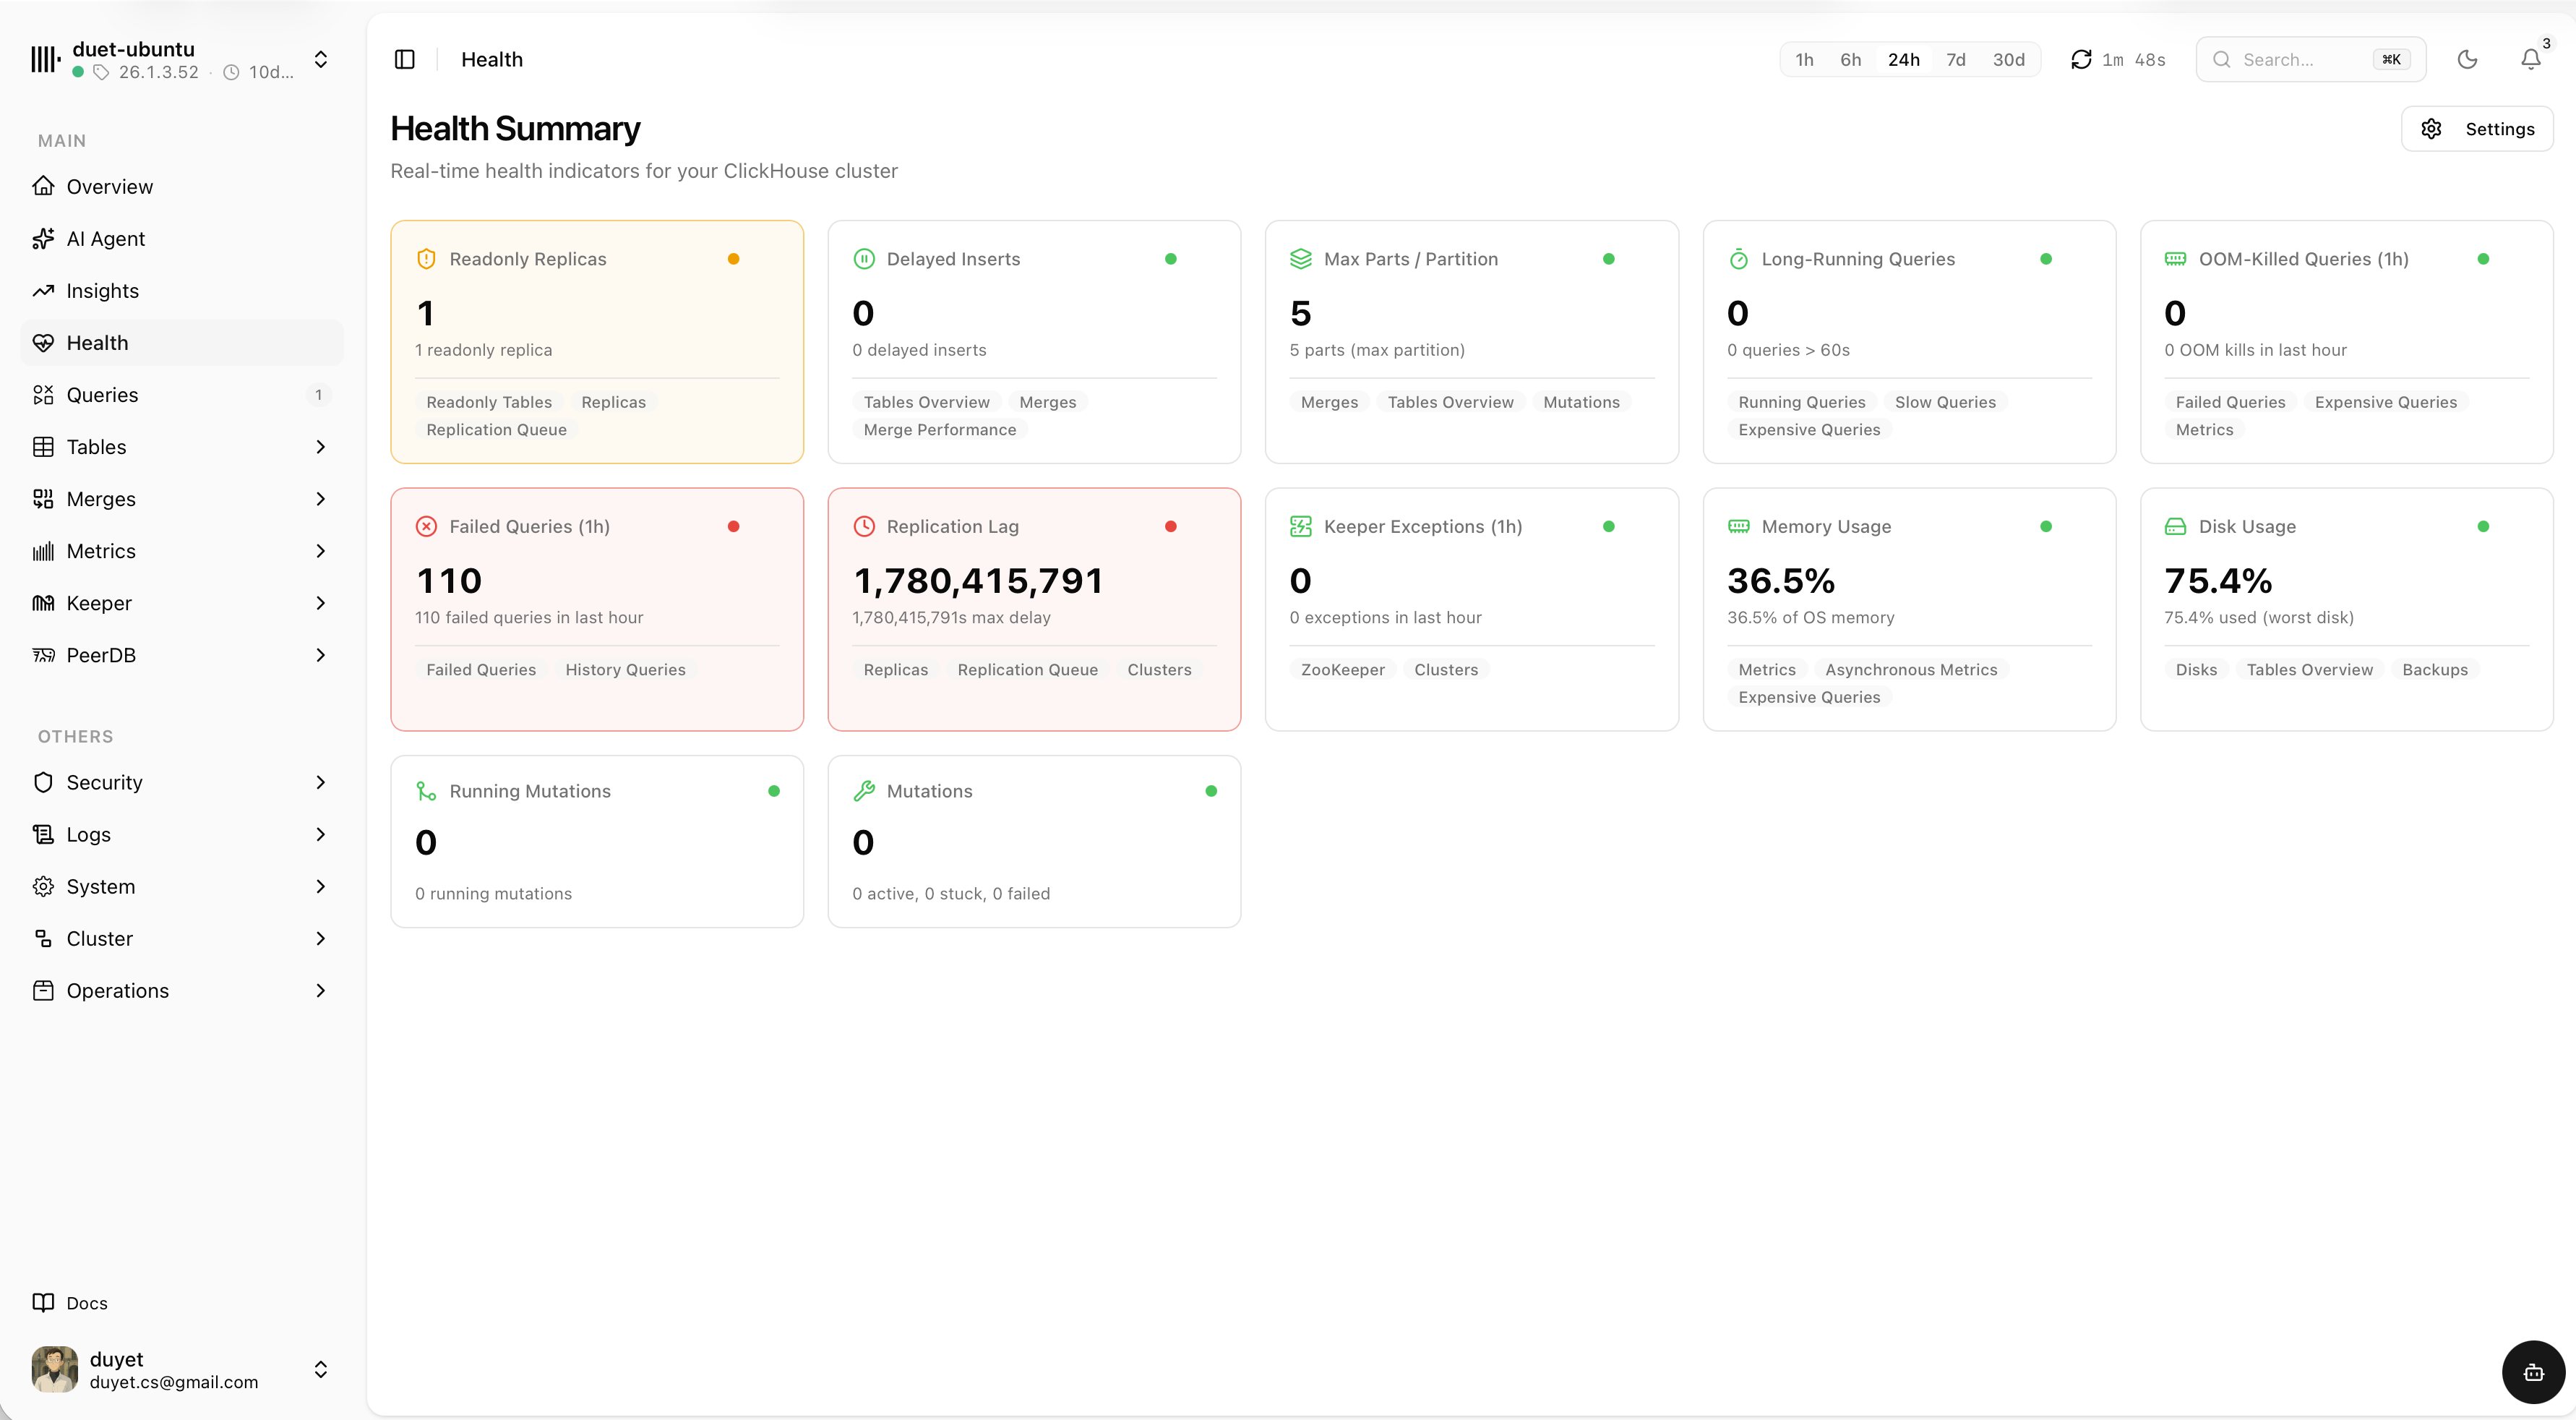
Real-time health indicators for the whole cluster — replication lag, failed queries, disk and memory, stuck mutations and more. When something turns red, generate a ready-to-paste prompt that briefs your AI agent to debug it.
Every health signal, color-coded
A single board of indicators — green, warn or critical at a glance — each linking straight to the views that explain it.
- Replication lag, readonly replicas and delayed inserts
- Failed and long-running queries, OOM kills, Keeper exceptions
- Disk, memory, parts-per-partition and mutation status
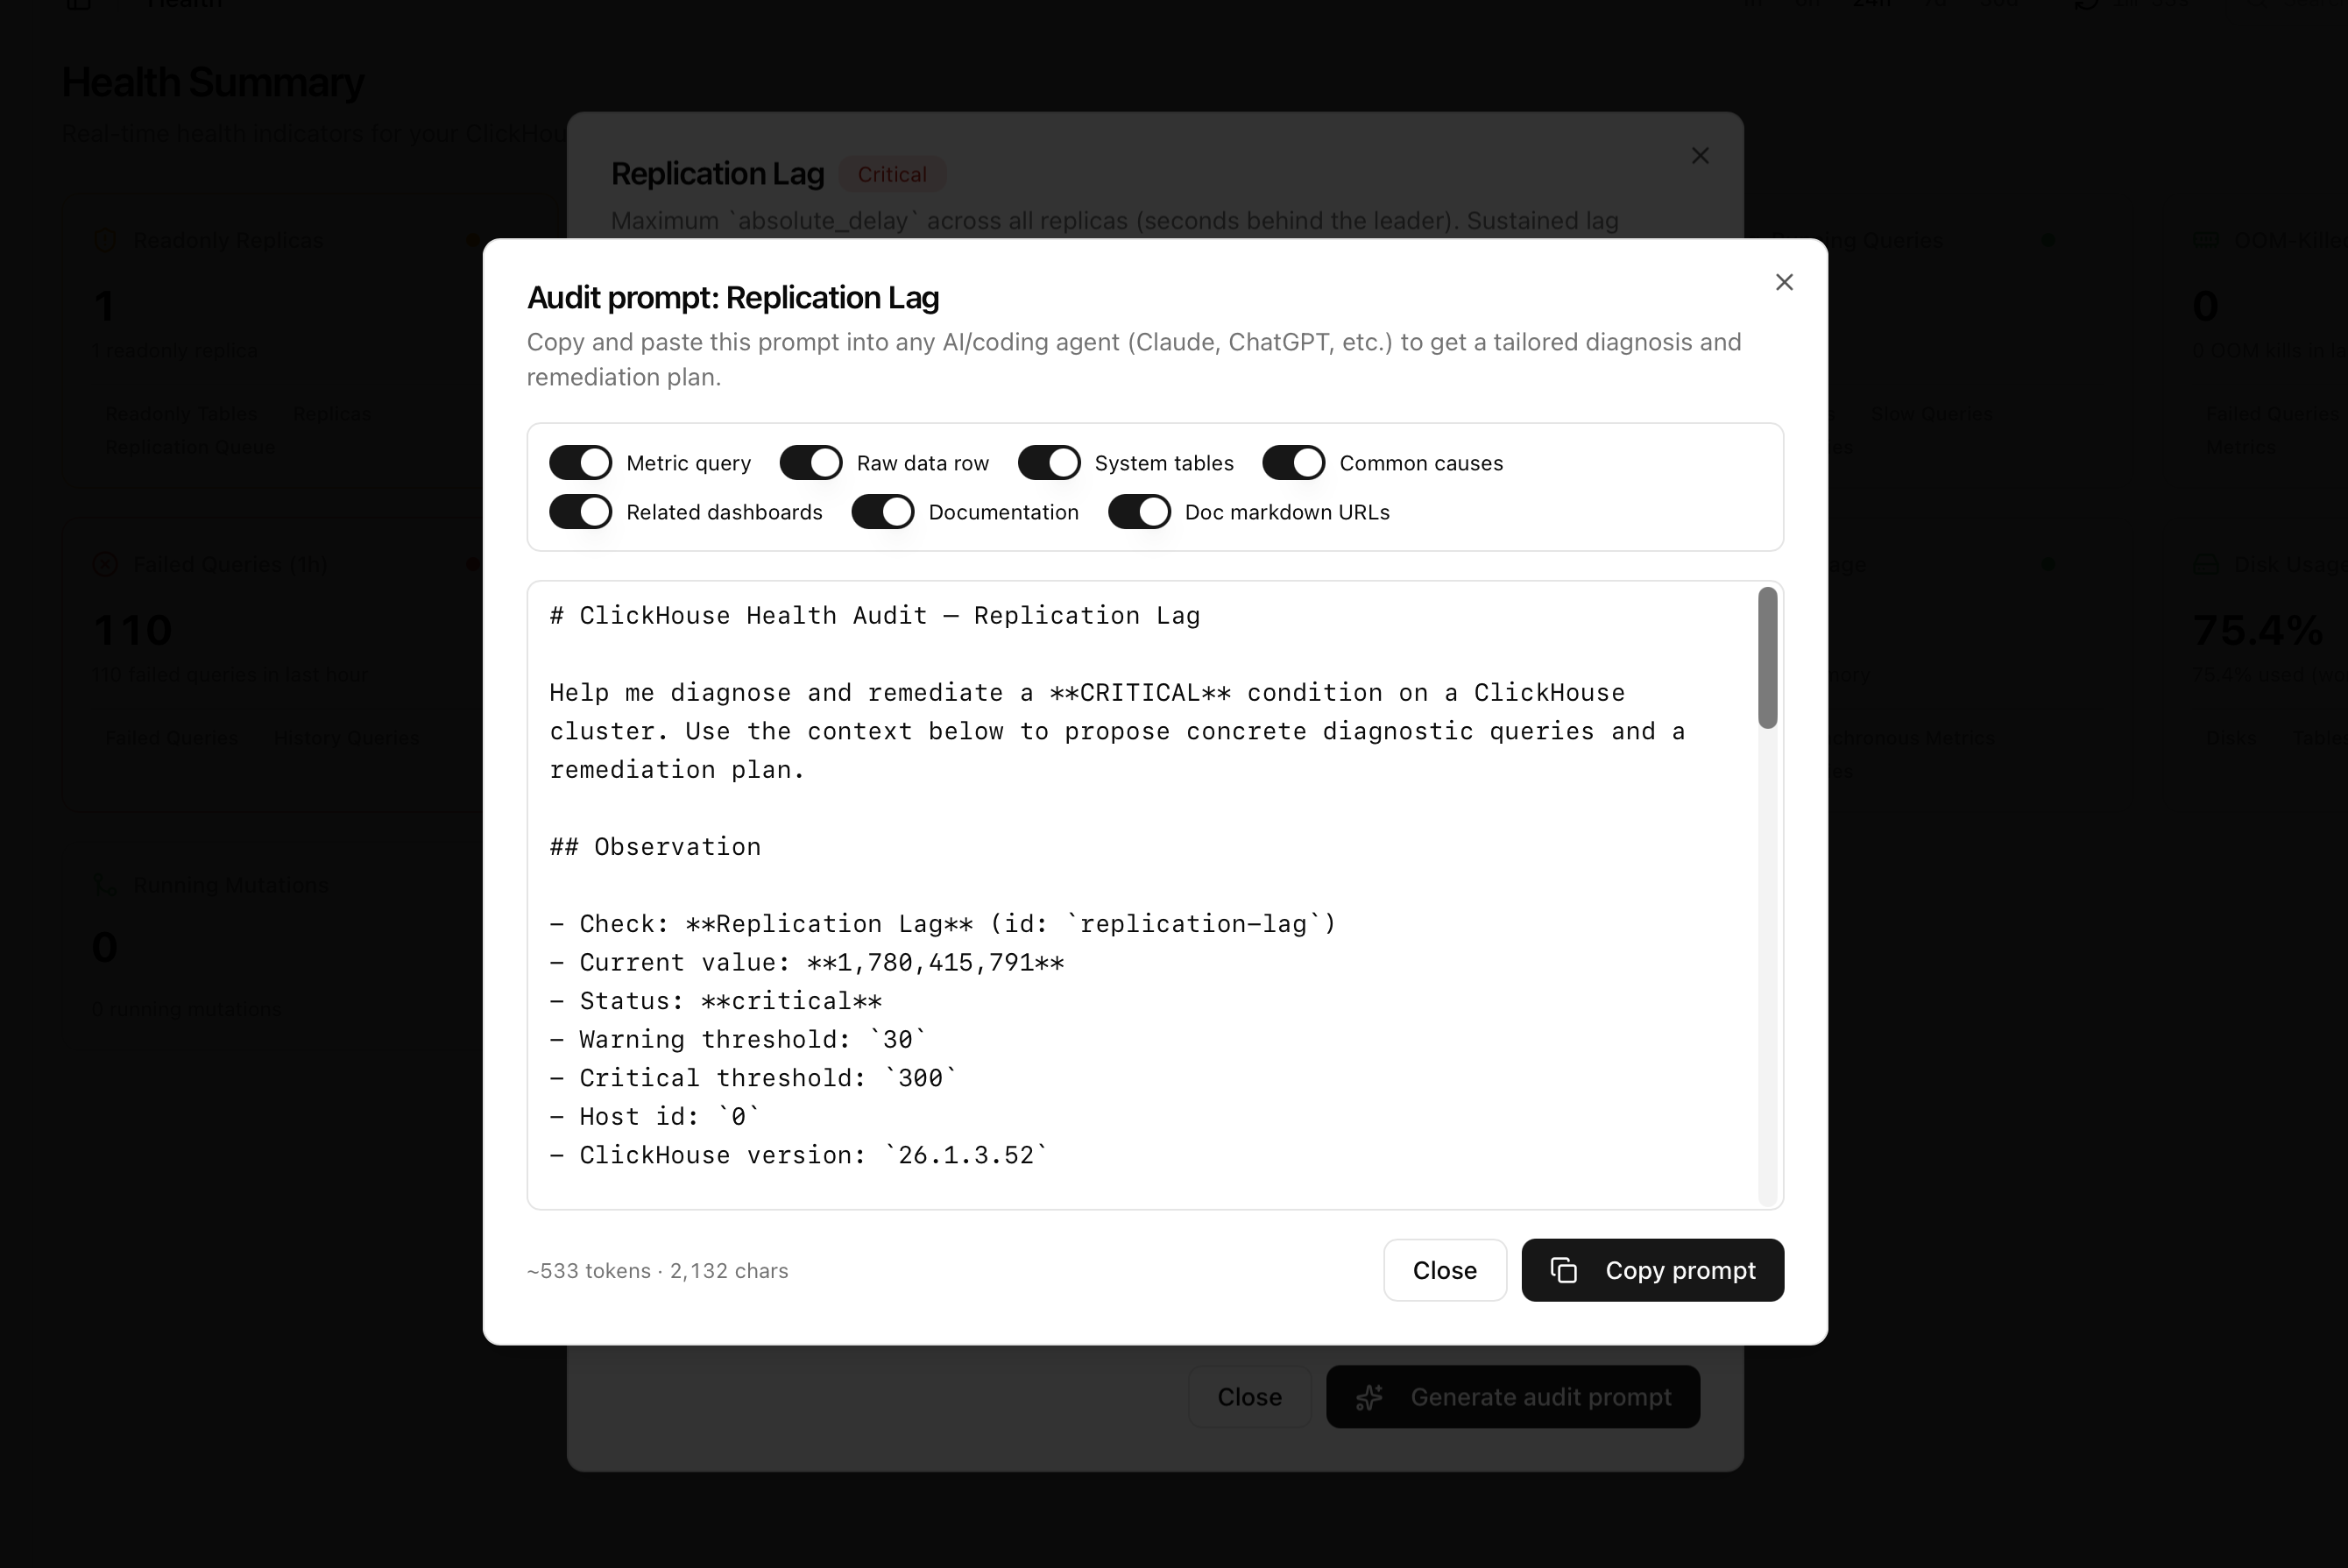
A ready audit prompt for your agent
One click turns any failing check into a structured prompt — the metric query, raw data, relevant system tables, common causes and docs. Paste it into Claude, ChatGPT or your coding agent for a tailored diagnosis and remediation plan.
- Toggle exactly what context to include
- Live values, thresholds, host and version baked in
- Copy as Markdown — works with any AI tool
One dashboard for the whole cluster
From a high-level overview down to ZooKeeper logs and replication mirrors — every system table you reach for, already laid out.
Overview & health
CPU, memory, connections and replication status at a glance, with health checks across the cluster.
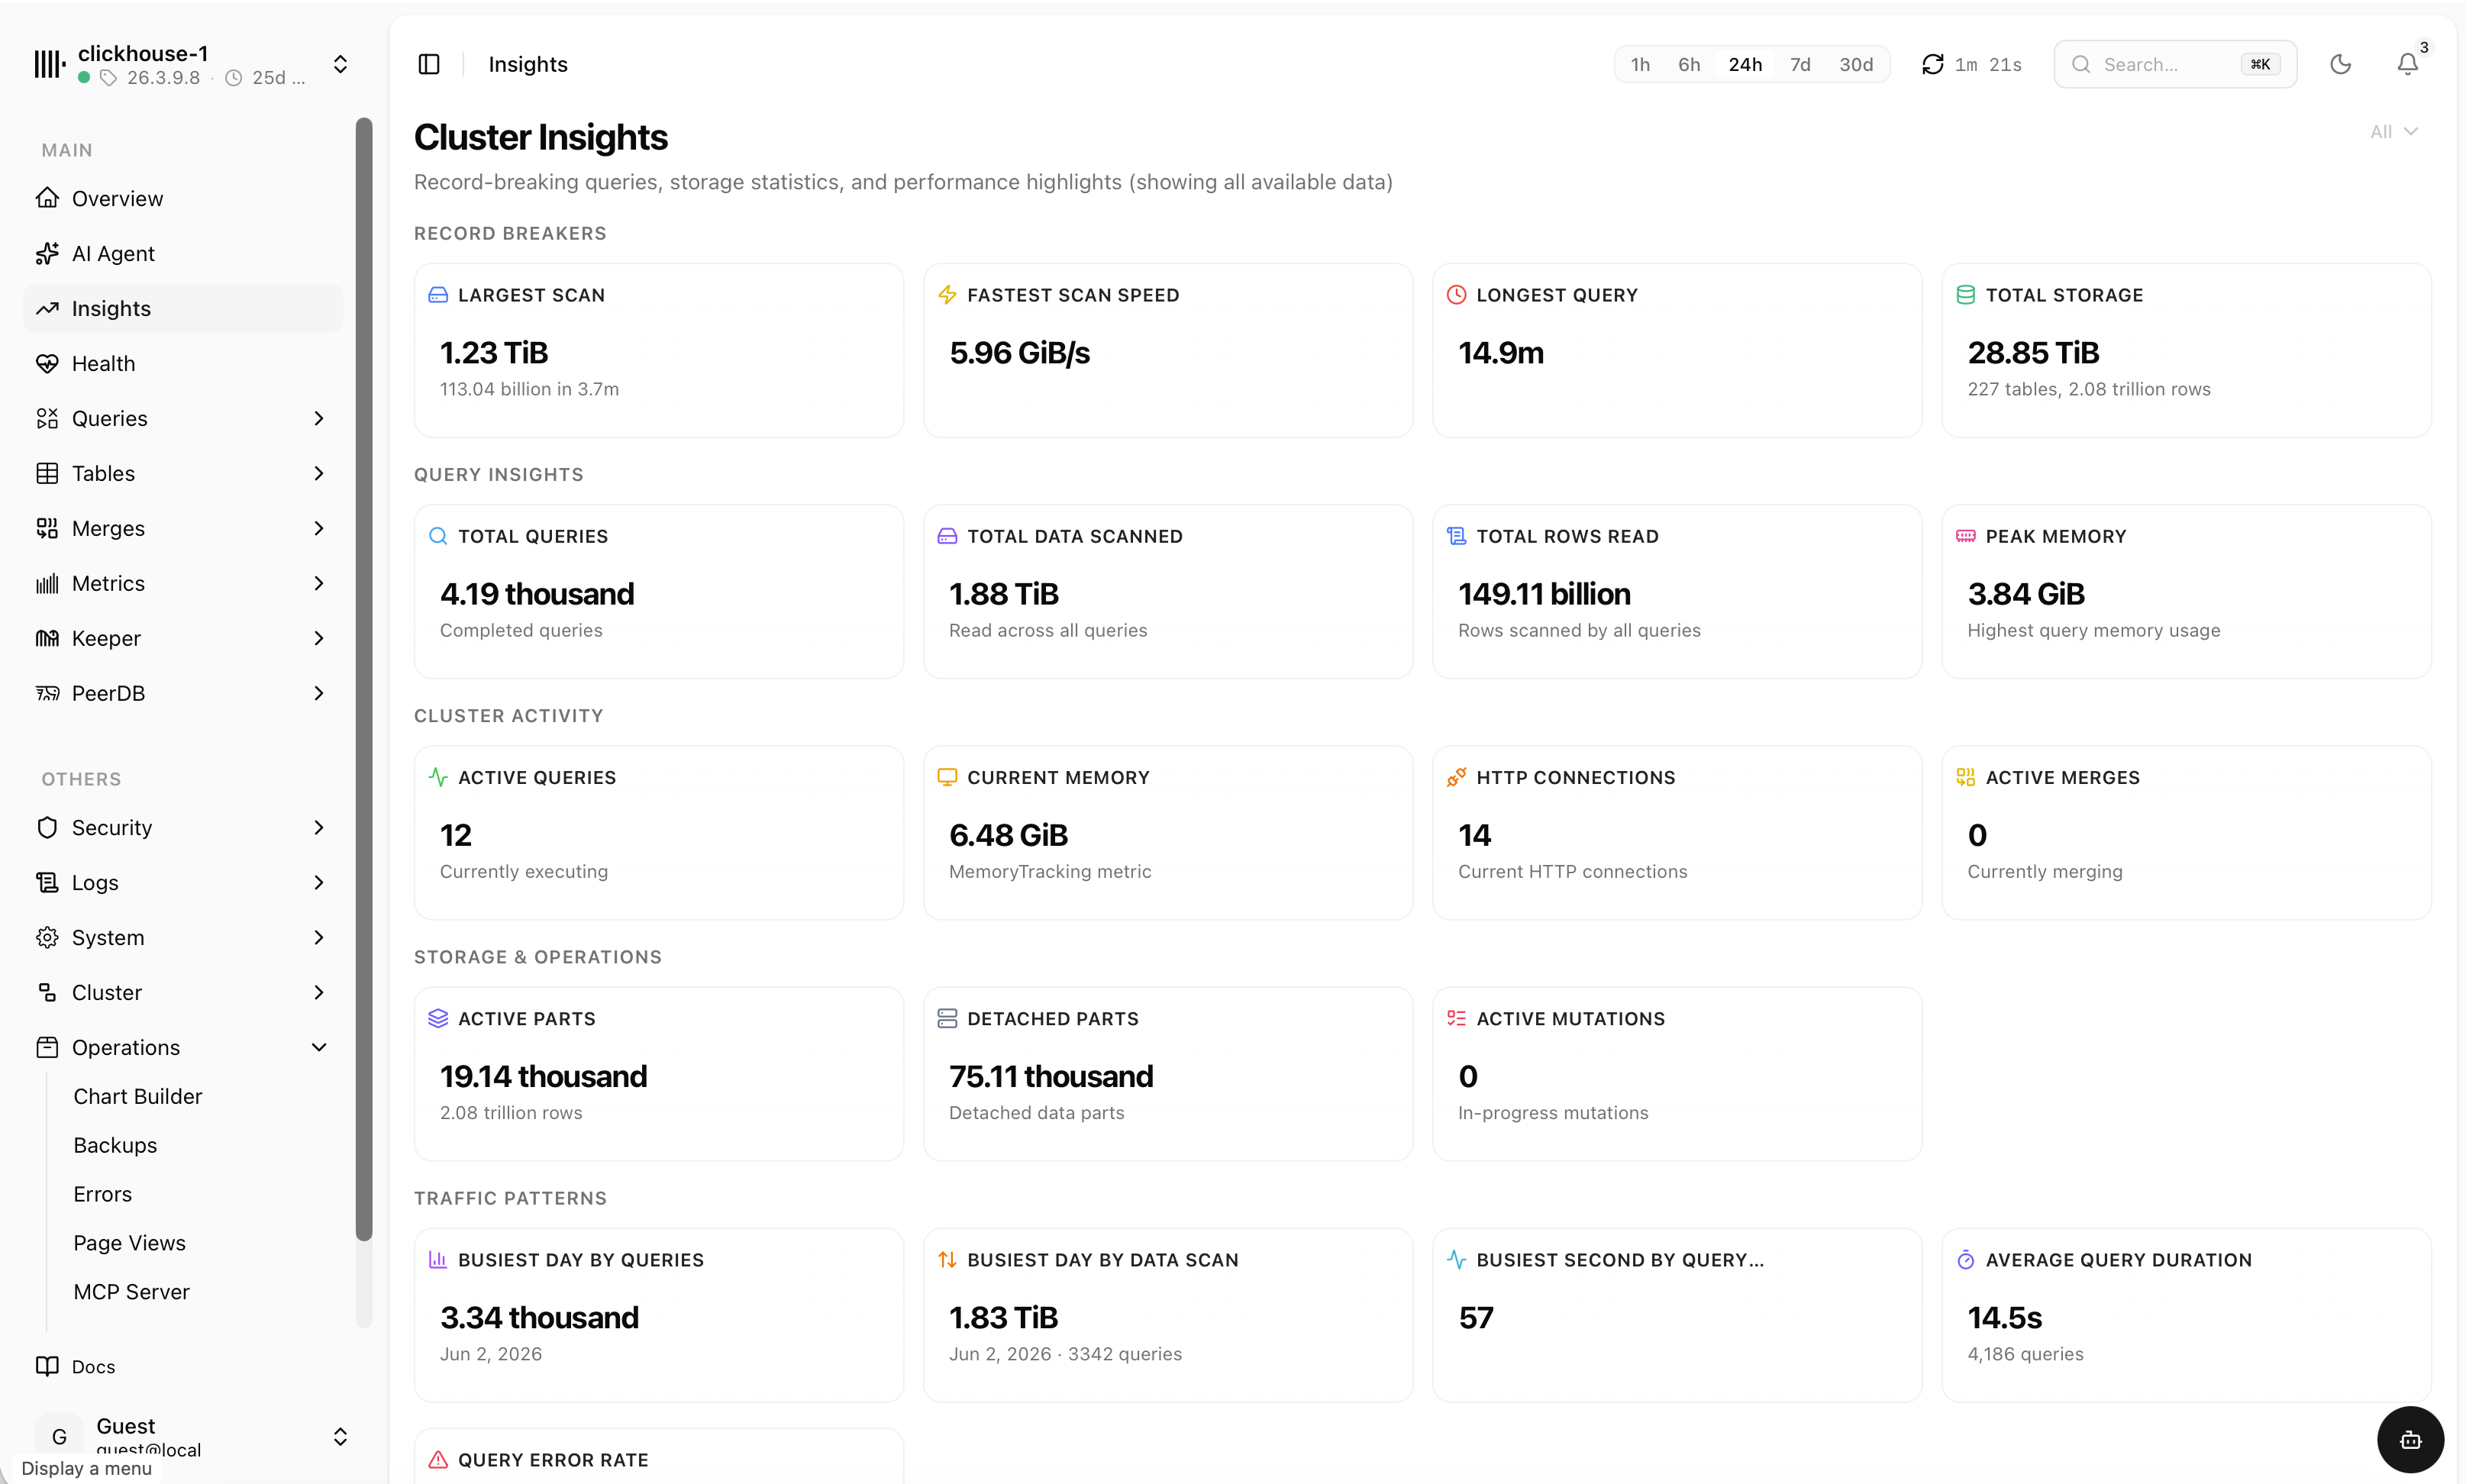
Cluster insights
Record-breaking scans, busiest days, total rows read and storage — the highlights from all your data.
PeerDB replication
Watch mirrors and peers with live status, rows-synced trend and routing — failures surface immediately.
Merges & parts
A live part-lifecycle timeline with merges, mutations, moves and part-size distribution by table.
Security & access
Users, roles, grants and quotas — review who can touch what, all from the same place.
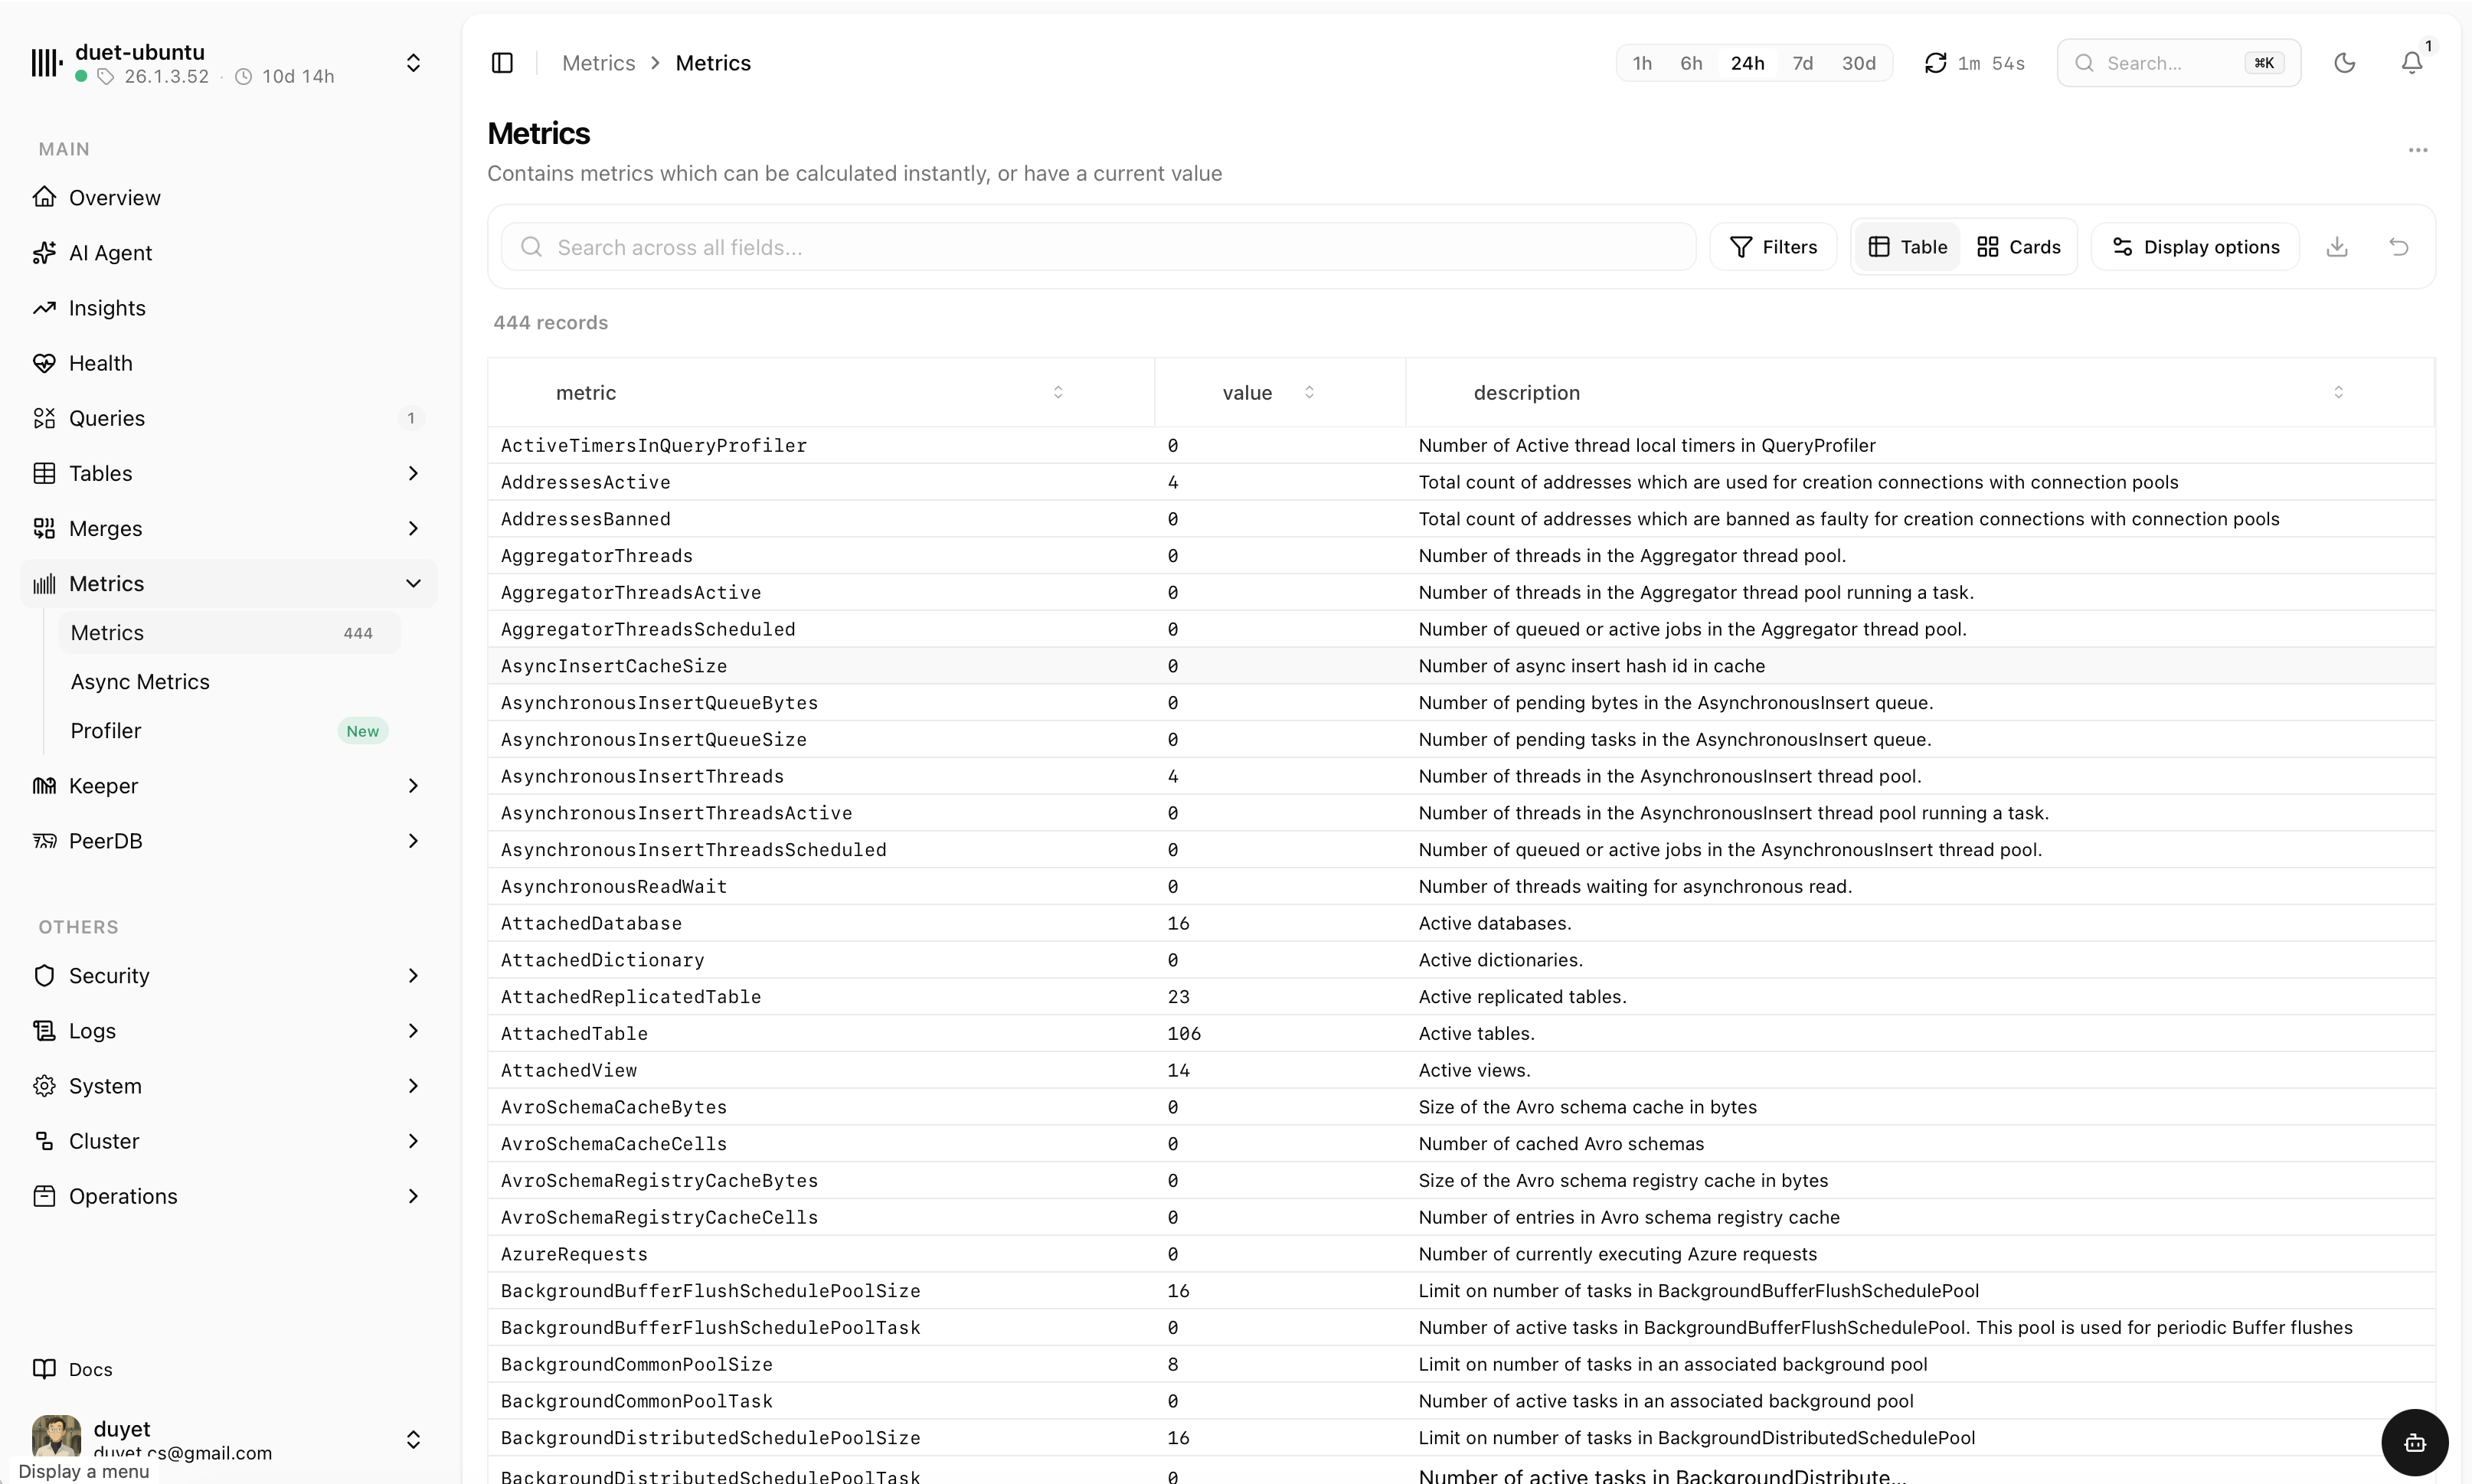
Logs & system
Query, error, trace and ZooKeeper logs alongside settings and metrics — searchable and time-ranged.
Self-host it, or use the cloud
chmonitor is open source. Deploy it to Cloudflare Workers, run it as a Docker container, or install the Helm chart on Kubernetes — or skip setup entirely and connect through the hosted cloud. Same UI, your choice.
- Up in minutesPoint it at a ClickHouse connection string and you're monitoring.
- Read-only by designConnect with a least-privilege user — chmonitor only reads system tables.
- Yours to extendGPL-3.0 licensed, community-driven, contributions welcome.
Edge hosting via the OpenNext adapter — no servers to run.
Single container from GHCR. Pin a release tag in production.
localhost points at the container — use host.docker.internal (--add-host=host.docker.internal:host-gateway on Linux).Chart vendored at deploy/helm/chmonitor — Secret-backed password, non-root uid 1001, health probes.
--set (use clickhouse.existingSecret), enable Ingress, and set autoscaling.enabled=true.Start monitoring in minutes
Open the hosted dashboard and connect a cluster, or grab the source and run it yourself.